library(shiny)
# 1. Business Logic
# This code only needs to run once - when the App opens
# It does not have to react to any user inputs

# 2. Define the UI for the app to get inputs and display outputs
ui <- fluidPage(
  ## Stuff for defining user-interface
  ## e.g. Title,
  ##      Table of contents
  ##      Location of inputs (sliders and buttons)
)

# 3. Define server logic to manipulate input objects, data,
#  to produce output objects
server <- function(input, output) {
  ## Stuff for running R code
  ## e.g. Run a linear model.
  ##      Manipulate a data frame
  ##      Make a plot.
}

# Create the application
shinyApp(ui = ui, server = server)10 Shiny Basics
Keywords
R Shiny, Shiny UI, Shiny Server, shiny input elements, shiny output elements
10.1 Introduction
10.1.1 Learning Outcomes
- Develop basic Shiny Apps using the {shiny} package.
- Create new apps using the appropriate directory structure.
- Create various elements in the user interface portion of the app code.
- Connect User Input IDs and Output IDs to create dynamic elements in the User Interface.
10.1.2 References:
- R for Data Science 2nd Edition Wickham et al. (2023)
- Mastering Shiny Wickham (2022)
- {shiny} package Chang et al. (2022)
- {DT} package Xie et al. (2023)
10.1.2.1 Other References
- Shiny Cheatsheet.
- Shiny Website Posit (2023)
- Shiny Examples.
- Shiny Videos on YouTube
- Engineering Production-Grade Shiny Apps Fay et al. (2023)
10.2 Overview of Shiny
As a data scientist, you will collaborate with researchers / managers / clients who do not know or have access to R or python.
You may need to allow them to explore the data/analysis themselves, or you want to interactively explore the data together.
Shiny lets you build an app you can run in a browser while R (or Python) runs underneath.
As examples:
- The Shiny package has eleven built-in examples that each demonstrate how Shiny works, e.g.,
shiny::runExample("01_hello"). - Folks showcase some pretty sophisticated interactive data visualizations Shiny Demo Gallery.
- If you get really good at Shiny, you can make sophisticated websites with it: Better Shoes.
Shiny acts as a wrapper if you will for HTML and CSS as it translates your R code into HTML and CSS sufficient to run an app.
- You can build apps without learning HTML, CSS, or JavaScript.
- However, just a little knowledge can help you customize your app to achieve the look and feel you want.
Shiny Apps Support Interactive Exploration and Visualization through three visible operations:
- Allow the user to choose inputs.
- Execute code to create input objects and manipulate them to produce output objects.
- Display static and dynamic output back to the user.
Behind the scenes, Shiny apps employ Reactive Programming to execute multiple tasks:
- Track object updates and the dependencies among objects.
- React to input and output object updates.
- Synchronize across all object updates.
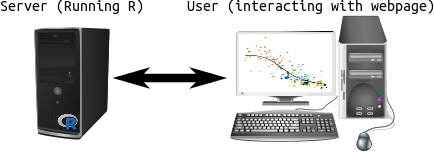
Shiny apps have two main parts as seen in Figure 10.1.
- The user interface (UI) runs in a web browser.
- The shiny app server code runs on a machine set up as shiny server (your local computer for now).
10.3 Creating Shiny Apps
You write shiny apps in .R files.
- Basic apps have all the code in one file that should be named
app.R. - More complicated (or older) apps may use two files: one for the user interface code and one for the server code.
- Even more complicated apps use multiple files organized as Shiny Modules.
- It’s a trade off between complexity and maintainability.
We will work with one file for now.
10.3.1 Directory or Folder Structure for {shiny} Apps.
Since the main code must be in a file with a specific name, e.g., app.R, you can’t manage or distinguish apps by file name of the file with your code.
- Use a distinct top-level folder name to distinguish between apps, e.g.
myfirstapp.
The following structure is recommended for your {shiny} apps to allow you to manage them AND to prepare for success:).
Folder - myfirstapp\
data-raw\: for original (messy) data and files with code to clean it.data\: for cleaned processed data. Each file in this directory should be a .Rds file (created byreadr::write_rds().images\a sub-directory for any images needed by the app.tests\: for test code and filesvignettes\: R Markdown files for your vignette
Recommend using this structure for your final project.
If you want to create your app as a package, you will use a R\: for all files with code needed to run the app - see Chapter 20 Mastering Shiny - Packages and Engineering Production Grade Shiny.
10.3.2 File Naming Conventions
Since all code files for running the app are together at the top level of the folder, a file naming convention can help organize the files for easier maintenance.
The following may be useful for more complicated apps.
app_*.R(or app_ui.R and app_server.R) file(s) contain the top level functions defining your user interface and your server function.If your app is large enough to use modules or external functions and utilities suggest the following:
fct_*.Rfiles contains the business logic, potentially large functions. They are the backbone of the application and may not be specific to a given module.mod_*.Rfiles contain a unique module (if you use them). Many Shiny apps contain a series of tabs, or at least a tab-like pattern, so number them according to their step in the application.- Tabs are almost always named in the user interface, so use the tab-name as the file name.
- For example, if the first tab is called “Import”, name its file
mod_01_import.R.
utils_*.Rfiles contain small helper functions.- For example, you might have a
not_na(), which isnot_na() <- Negate(is.na), anot_null(), or other small tools used application-wide.
- For example, you might have a
10.3.3 Structure of a {Shiny} App.
Every app.R File has the same basic structure with three main sections followed by the line with the function call to create the app object.
- Business Logic Section
- User Interface Section
- Server Section
The sections of the app.R File Handle Different Tasks
- Business Logic
- Implements code that does not depend upon, or need to, react to user input or later analysis, e.g.,
- Load the shiny library (and other libraries),
- Load pre-determined data files,
- Manipulate the pre-loaded data to tidy, clean, and create the information you need for the user (if not already done and saved in the data folder as a
.Rdsfile). - Define functions to simplify your later code.
- All of this code should be able to be run in a normal
.Rscript file to debug or potentially operate separately.
- User Interface
- Defines the user interface using a page layout function such as the
fluidPage()function.- The user interface defines things like page layout (title, headers, table of contents), and sources of input (number sliders and buttons).
- Saves the output of
fluidPage()to a variable (calleduiabove).
- Server Logic
- The code to do everything else required to respond to user inputs and create new output values.
- Creates the server logic as a single R function e.g.,
server <- function(){...}.- This is just regular R code wrapped in some special Shiny functions.
- The shiny functions allow access to the input objects in the shiny app environment.
- You can use input to manipulate data frames, fit statistical models, or make plots, etc..
- Last Line
- Calls the
shinyApp()function, with the names of the outputs fromfluidPage()and the server function.- This is the same for all
app.Rfiles.
- This is the same for all
- Note: Shiny has several UI Page Layout Functions besides
fluidPage()
10.3.4 Your First Shiny App
10.3.4.1 Use RStudio to Create a Directory and app.R File for a new Shiny App
You can create a basic Shiny app in RStudio by clicking File/New "Shiny Web App...:
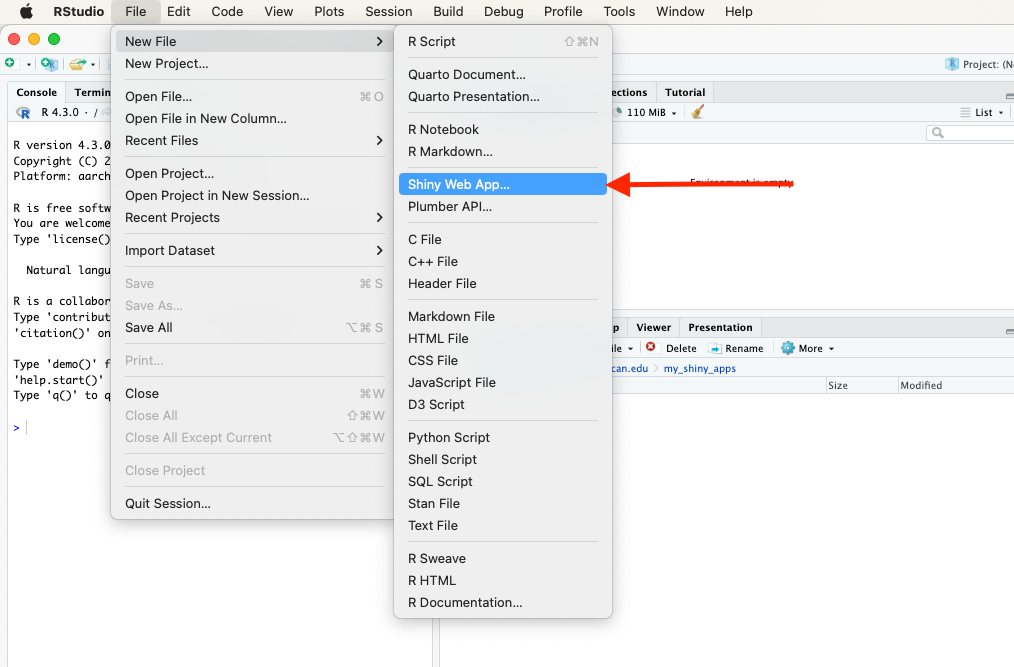
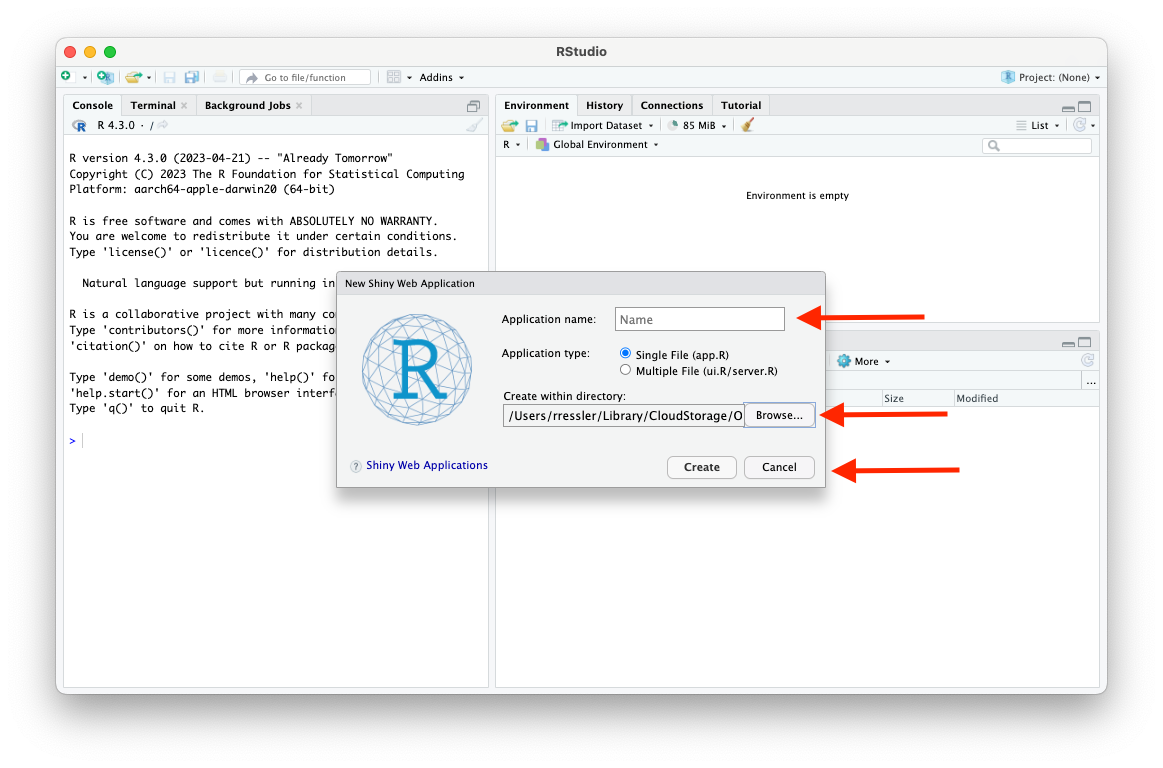
A pop-up window will ask for the name of your new shiny app and the directory where you want it created.
- The name needs to follow the R conventions for variable naming.
- The name cannot start with a number or use special characters
RStudio will create a new folder under the directory you specified with the name you entered for your App.
Let’s call our shiny app my_first_app.
RStudio provides a complete starter template file app.R under the new directory.
- It should look like this:
#
# This is a Shiny web application. You can run the application by clicking
# the 'Run App' button above.
#
# Find out more about building applications with Shiny here:
#
# http://shiny.rstudio.com/
#
library(shiny)
# Define UI for application that draws a histogram
ui <- fluidPage(
# Application title
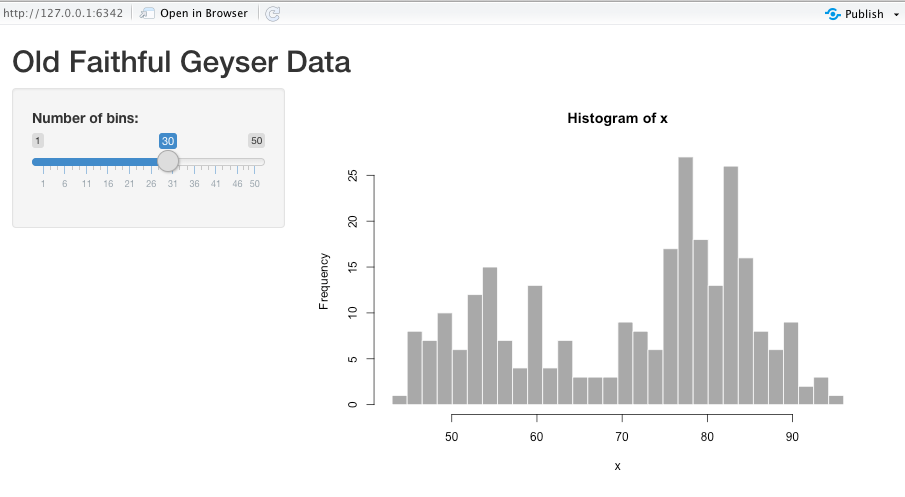
titlePanel("Old Faithful Geyser Data"),
# Sidebar with a slider input for number of bins
sidebarLayout(
sidebarPanel(
sliderInput("bins",
"Number of bins:",
min = 1,
max = 50,
value = 30
)
),
# Show a plot of the generated distribution
mainPanel(
plotOutput("distPlot")
)
)
)
# Define server logic required to draw a histogram
server <- function(input, output) {
output$distPlot <- renderPlot({
# generate bins based on input$bins from ui.R
x <- faithful[, 2]
bins <- seq(min(x), max(x), length.out = input$bins + 1)
# draw the histogram with the specified number of bins
hist(x, breaks = bins, col = "darkgray", border = "white")
})
}
# Run the application
shinyApp(ui = ui, server = server)10.3.4.2 Running your App
With this app.R file open, click on Run App at the top right of your Source panel.
Notice your console is busy.
You cannot run R code in the console while the shiny app is running.
Your console should say something like “
Listening on http://127.0.0.1:6342”, but the url will be different.- You can put the URL into your web browser to see the running Shiny App.
- Don’t worry, it’s still on your computer. The URL just points to a location on your machine.
Exit out of the Shiny App by:
- Clicking the stop sign on your Viewer Tab, or,
- Hitting CTRL + C while you are in the console, or,
- Closing the Shiny App window.
10.4 User Interface Input Elements
The user interface is defined by everything within the fluidPage() section.
fluidPage()has a simple default layout with consists of rows which in turn include columns.- Rows ensure elements appear on the same line.
- Columns define how may units of a 12-unit wide grid are allocated for each element.
- Fluid pages scale their components in realtime to fill all available browser width.
Shiny provides a number of page layout functions besides fluidPage().
- Each serves as a template for creating common layouts for user interface elements to collect user inputs.
- These include:
fillPage(),fixedPage(),flowLayout(),navbarPage(),sidebarLayout(),splitLayout(), andverticalLayout().
There can be hierarchical (nested) layouts within each of these to enable very rich and complex UIs.
10.4.1 Let’s Create a Bare Bones Template
Create a new shiny app called “tryouts”.
To make it bare bones:
- Delete all the template code.
- Start typing
shinyappin the file and selectshinyapp {snippet}from the auto-complete list to generate the following.
- Recommend using the above as a template for all future Shiny apps.
- It is the minimal amount of coded needed to start a Shiny app.
Running this app should just produce a blank HTML page in the browser.
10.4.2 User Input functions
Populate fluidPage(), with calls to shiny functions for input elements with each call separated by a comma.
Four common arguments to fluidPage() are calls to functions for different types of UI input elements:
textInput()numericInput()sliderInput()selectInput()
Each of these input functions requires at least three arguments:
inputId: The name of the input object. Theserver()function will access user inputs through theinputId, so it needs to follow the conventions for variable naming.- character strings with no spaces and can’t start with a number
label: The name displayed on the web-app to the user.value: A default input.
Each input function may also take many more arguments specific to that type of input.
- The page layout function creates an R list of the
inputIdsso the server function can find them.
Tip
A difficult error to debug is when an inputId in the server side has a typo in it.
The server function just ignores the unknown ID but does not stop or generate an error message.
If you are having trouble with an app not doing what you expect and there is no error message, check the id name is spelled the same in the UI section and the server section.
10.4.3 Get Text Inputs with textInput(), passwordInput() and textAreaInput()
textInput() accepts one line of text from the user.
passwordInput() accepts one line of text which is not displayed on the screen as it is entered. (NOTE: This is not a secure way to collect passwords by itself.)
textAreaInput() accepts multiple lines of text.
Add these elements to your tryouts app:
Running the app, you should get something like this:
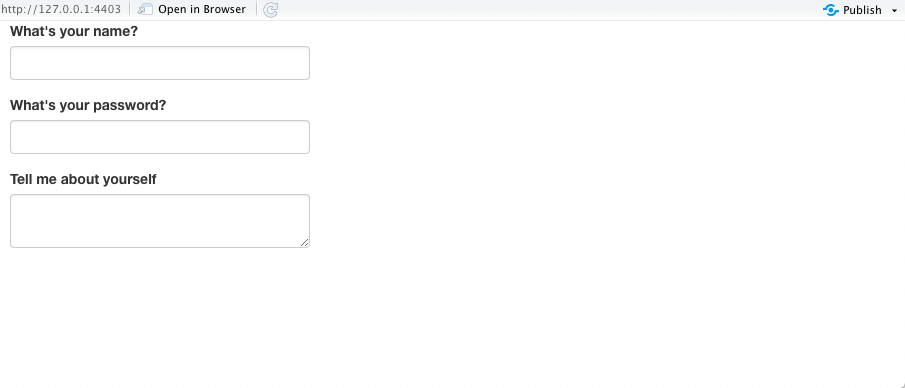
Later on, we’ll cover how to access these inputs in the server function().
- Change the
widthandheightarguments intextAreaInput(). What does it do?
It changes the default width and height of the text box.
- Change the
valueargument intextInput(). What does it do?
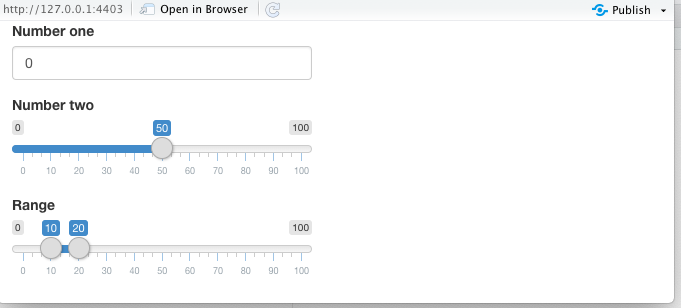
It changes the default text in the text box.10.4.4 Get Numeric Inputs with numericInput() and sliderInput()
numericInput() creates a text box that only accepts numeric values.
sliderInput() creates a numeric slider.
- Giving the
valueargument one number results in a one-sided slider. - Giving the
valueargument a vector of two numbers results in a two-sided slider (min, max).
library(shiny)

ui <- fluidPage(
  numericInput("num", "Number one", value = 0, min = 0, max = 100),
  sliderInput("num2", "Number two", value = 50, min = 0, max = 100),
  sliderInput("rng", "Range", value = c(10, 20), min = 0, max = 100)
)

server <- function(input, output) {

}

shinyApp(ui = ui, server = server)
Running the app, you should get something like this:
- Only use sliders for small ranges where the exact number is not important.
What does the animate option do when you set it to TRUE?
If you push play, the slider slowly slides up until it reaches the maximum value.
- You can see more on sliders at Using Sliders.
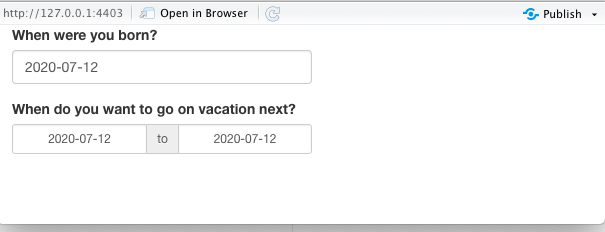
10.4.5 Get Date Inputs with dateInput() and dateRangeInput()
Use dateInput() to collect a single date.
Use dateRangeInput() to collect two dates.
Running the app, you should get something like this:
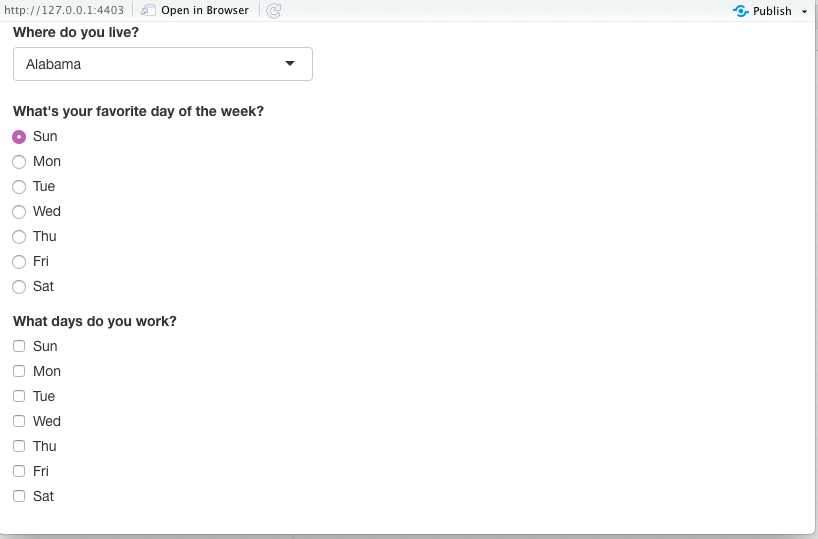
10.4.6 Get Multiple Choice Input with selectInput(), radioButtons(), or checkboxGroupInput()
Use selectInput() to provide the user with a drop-down menu.
Use radioButtons() to have a multiple choice button selection where only one selection is possible.
Use checkboxGroupInput() to have a multiple choice button selection where multiple selections are possible.
library(shiny)

weekdays <- c("Sun", "Mon", "Tue", "Wed", "Thu", "Fri", "Sat")
ui <- fluidPage(
  selectInput("state", "Where do you live?",
    choices = state.name
  ),
  radioButtons("weekday", "What's your favorite day of the week?",
    choices = weekdays
  ),
  checkboxGroupInput("weekday2", "What days do you work?",
    choices = weekdays
  )
)

server <- function(input, output) {

}

shinyApp(ui = ui, server = server)
Running the app, you should get something like:
What does multiple = TRUE do in in selectInput()?
It allows for multiple inputs.
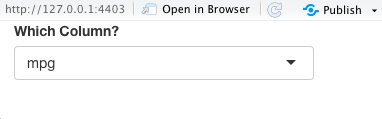
10.4.7 Select Columns of a Data Frame with varSelectInput()
varSelectInput() allows a user to select a variable (column) from a data frame already loaded in the environment.
- We will do this a lot!
Running the app, you should get something like:
ImportantUsing
varSelectInput() in the Server
varSelectInput() allows a user to select a column from a data frame.
- In the server function, the corresponding value (e.g.,
input$var_name) is not the data itself, but a reference to a variable in the data frame.
Shiny apps often use both tidyverse functions and base R functions when working with variables selected from data frames.
However,
- Tidyverse functions use data masking which lets you refer to columns by name without quotes or the
$operator (e.g.,aes(mpg, wt)). - Base R functions do not use data masking so require you to explicitly reference columns, either with the
$operator (e.g.,mtcars$mpg) or by indexing with[[ ]]using the column name in quotes (e.g.,mtcars[["mpg"]]).
Because tidyverse functions and base R functions evaluate variable names differently, you must use different syntax in each case when input$var_name comes from a varSelectInput().
- Tidyverse functions, e.g.,
ggplot(),dplyr::select()- Use the injection operator
!!to insert the selected variable into the expression.
- Use the injection operator
ggplot(mtcars, aes(x = !!input$var_name_x, y = !!input$var_name_y)) +
geom_point()- The
!!operator tells tidyverse functions to treatinput$var_name_xandinput$var_name_yas column names inside the data frame.
- Base R functions, e.g.,
t.test,lm(),is.character()- Use the extraction operator
[[]]to reference the column:
- Use the extraction operator
mtcars[[input$var_name]]The [[ ]] operator extracts the column whose name matches the selected variable.
You do not need to fully understand tidy evaluation with data masking to use this pattern — just remember:
- Tidyverse ->
11 - Base R ->
[[]]
We’ll see a full example of this in the “Putting Inputs and Outputs Together” section, Section 10.6.
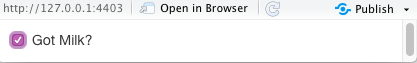
10.4.8 Get Binary (TRUE/FALSE) Inputs with checkboxInput()
Use checkboxInput() to get a TRUE/FALSE or Yes/No answer.
Running the app, you should get something like this:
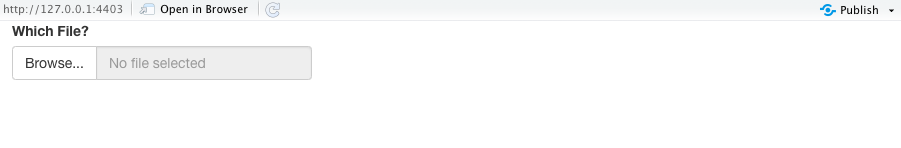
10.4.9 Get File Names for Inputs with fileInput()
fileInput() allows users to input one or more file names.
Running the app, you should get something like this:
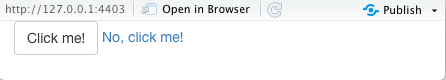
10.4.10 Create Action Buttons/Links with actionButton() or actionLink()
Use actionButton() to create a clickable button, or actionLink() to create a clickable link.
Running the app, you should get something like this:
10.5 User Interface Output Elements
Output functions create placeholders for the values of the objects created in the server function() (like plots and tables) to be displayed as output in the User Interface.
Each output function’s first argument is its outputId, just like the input elements.
- The server
function()can access this element as an element of theoutputlist. - For example, if the first argument is
outputId="plot", the server function can insert a plot intooutput$plot.
Each UI output function has an associated render function in the server function().
- A render function first uses the code in the R expression (that you wrote inside
{ }) to create an R output object, e.g., text, or a table, or a plot. The function then “renders” the object into HTML code that will generate the output produced by the expression and passes it to theui()function which will pass the HTML to the browser to display the output. - As an example, if you create a
renderPlot()expression to create a plot object, say usingggplot2(), therenderPlot()function will generate the HTML for displaying the plot and pass to theui()function to put in theoutput$plotplaceholder in the user interface.
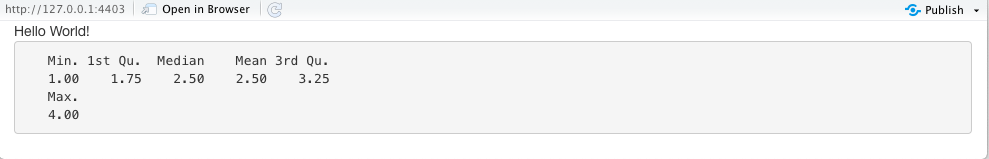
10.5.1 Display Text Output with textOutput() or verbatimTextOutput()
Use textOutput() to display text.
Use verbatimTextOutput() to display code.
Create text objects in the server function() with either renderText() or renderPrint().
renderText()will display text returned by code. Functions can only return one thing.renderPrint()will display text printed by code. Functions can print multiple things.- Use
verbatimTextOutput()withrenderPrint()to print results from outputs oft.test()orlm().
Running the app, you should get something like this:
Change the outputId from “text” to something else. Make sure the Shiny App still works.
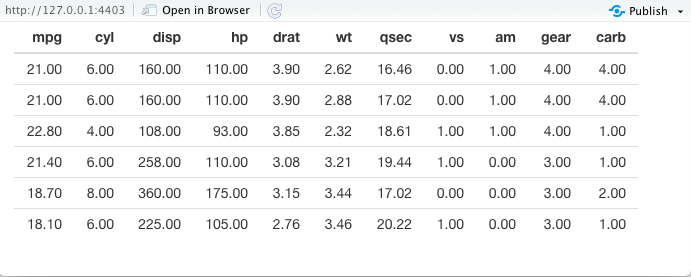
10.5.2 Display Output Tables with tableOutput() or DTOutput()
tableOutput() prints an entire table created in the server by renderTable().
- Should only be used for small tables.
Running the app, you should get something like this:
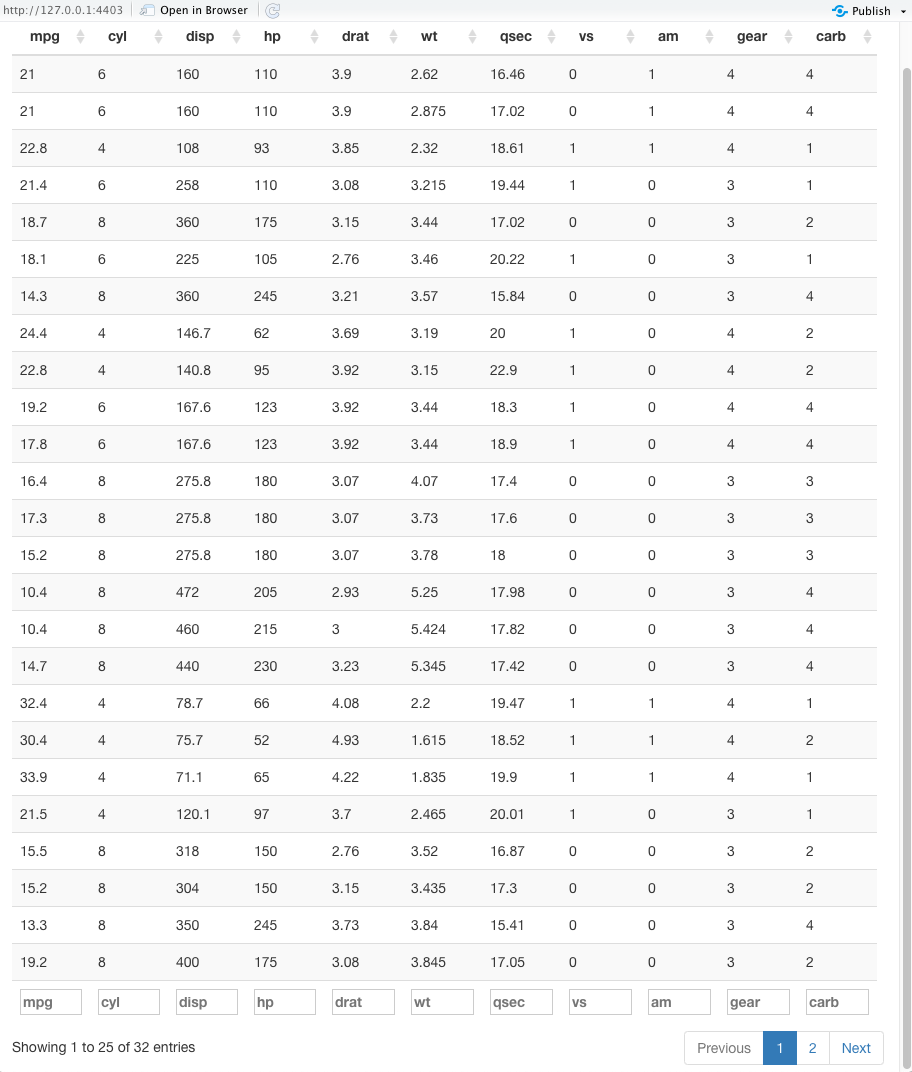
DTOutput() displays a dynamic table created in the server by renderDT().
Important
Shiny used to use the renderDataTable() function to create dynamic interactive tables. However that has been superseded and replaced by renderDT().
The renderDT() function is from the {DT} package (Data Tables package) which provides access to the JavaScript library DataTables. This package has more options for customizing your interactive tables.
You will need to install the package using the console and for each app, load the {DT} package in the business logic section with library(DT).
Running the app, you should get something like this:
You can change the appearance of DTOutput() by passing arguments as a list to the options argument in renderDT().
- You can find these options at: https://datatables.net/reference/option/.
Tip
When using {DT}, DTOutput() is an alias of dataTableOutput(), and renderDT() is an alias of renderDataTable().
It is recommended to use DTOutput() and renderDT() to avoid possible collisions with functions of the same names in {shiny} (shiny::dataTableOutput() and shiny::renderDataTable()).
- Remember to
library(DT)afterlibrary(shiny)in the business logic section of your app to use these functions.
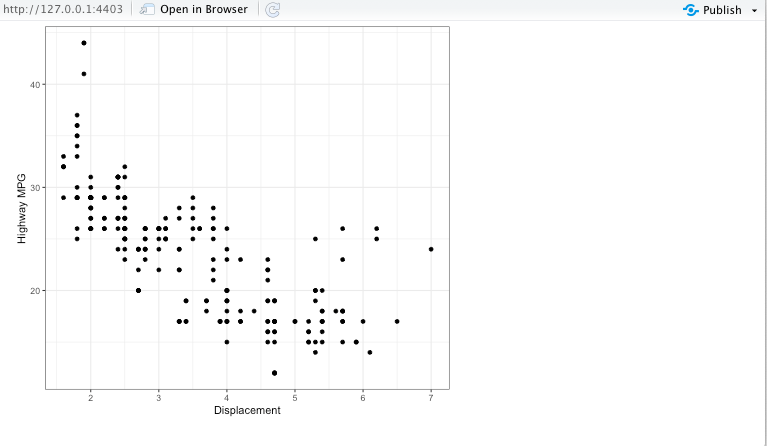
10.5.3 Output Plots to the UI with plotOutput()
plotOutput() displays plots created by renderPlot() in the server() function.
- Note we need to load {ggplot2} as well as {shiny}.
library(shiny)
library(ggplot2)

ui <- fluidPage(
  plotOutput("plot", width = "60%")
)

server <- function(input, output, session) {
  output$plot <- renderPlot({
    ggplot(mpg, aes(x = displ, y = hwy)) +
      geom_point() +
      theme_bw() +
      xlab("Displacement") +
      ylab("Highway MPG")
  })
}

shinyApp(ui = ui, server = server)
Running the app, you should get something like this:
Change the height and width of the plot by changing the argument values in renderPlot().
Change the height and width of the plot by changing the argument values in plotOutput().
Show code
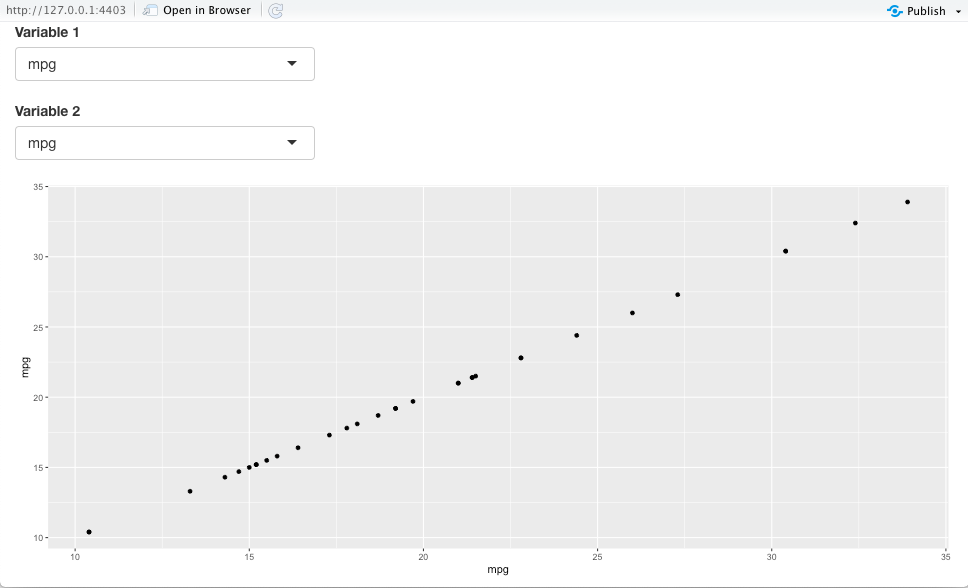
10.6 Putting Inputs and Outputs Together
Let’s build a simple shiny app that lets the user choose two variables from mtcars and then plots them.
- Start with the app template and make it bare bones.
- Load {shiny} and {ggplot2} at the beginning of the app, in the business logic section, before the
ui <- fluidPage(...). - Add the UI inputs and outputs.
- Add the server code to render the plot and assign to an output object.
library(shiny)
library(ggplot2)

ui <- fluidPage(
  varSelectInput("var1", "Variable 1", data = mtcars),
  varSelectInput("var2", "Variable 2", data = mtcars),
  plotOutput("plot")
)

server <- function(input, output) {
  output$plot <- renderPlot({
    ggplot(mtcars, aes(x = !!(input$var1), y = !!input$var2)) +
      geom_point()
  })
}

shinyApp(ui = ui, server = server)
Running the app, you should get something like this:
Notice how in the server function(),
We accessed the inputs via the
inputvariable.- These inputs must be used inside a render function to obtain reactivity.
We set the outputs to the
output()variable.Notice the use of the injection operator
!!in front ofinput$var1andinput$var2.- You have to do this to use data frame variable names in functions from the tidyverse ({ggplot}, {dplyr}, {tidyr}, etc) (but not base R where variable names are evaluated differently using
[[]]).
- You have to do this to use data frame variable names in functions from the tidyverse ({ggplot}, {dplyr}, {tidyr}, etc) (but not base R where variable names are evaluated differently using
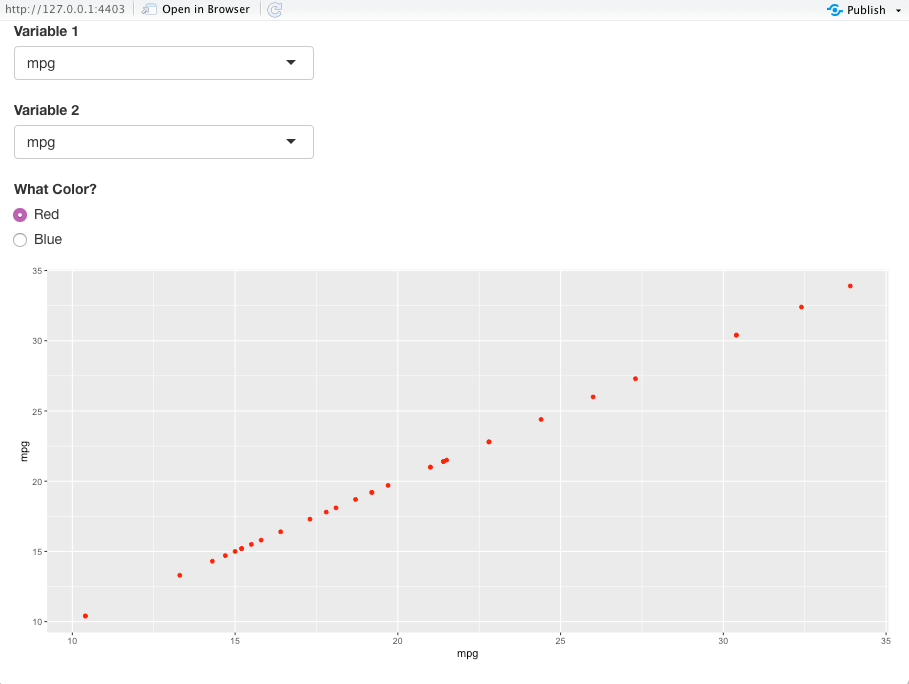
Let the user choose whether they want “red” points or “blue” points.
library(shiny)
library(ggplot2)

ui <- fluidPage(
  varSelectInput("var1", "Variable 1", data = mtcars),
  varSelectInput("var2", "Variable 2", data = mtcars),
  radioButtons("color", "What Color?",
    choiceNames = c("Red", "Blue"),
    choiceValues = c("red", "blue")
  ),
  plotOutput("plot")
)

server <- function(input, output) {
  output$plot <- renderPlot({
    ggplot(mtcars, aes(x = !!input$var1, y = !!input$var2)) +
      geom_point(color = input$color) #- Notice the non-use of `!!`
  })
}

shinyApp(ui = ui, server = server)
Running the app, you should get something like this:
10.6.1 Identifying varSelectInput() Data Frame Variables in Base R Functions
When a variable comes from varSelectInput(), base R functions do not use tidy evaluation. You must explicitly extract the selected column from the data frame using [[ ]].
The example below uses base R functions is.factor() and lm() with the built-in penguins dataset.
library(shiny)
num_penguins <- penguins |>
  dplyr::select(where(is.numeric))

ui <- fluidPage(
  varSelectInput("y", "Response (y)", data = num_penguins, selected = "bill_depth"),
  varSelectInput("x", "Predictor (x)", data = penguins, selected = "bill_length"),
  verbatimTextOutput("lm_results")
)

server <- function(input, output, session) {

  output$lm_results <- renderPrint({
    y <- num_penguins[[input$y]]
    x <- penguins[[input$x]]

    summary(lm(y ~ x))
  })
}

shinyApp(ui, server)
10.6.2 Variations of Text and Data Output
Given the different types of text elements, it can be confusing to ensure the input and output objects align with respect to formats.
Consider the following examples of alignment in the code and the results in Figure 10.2.
Notice what happens when you use broom::tidy() to convert the list output from the analysis of variance function aov to a data frame.
library(shiny)
library(DT)
library(broom)

data("mtcars")
aout <- aov(mpg ~ as.factor(cyl), data = mtcars)

ui <- fluidPage(
  textOutput("character_text"),
  textOutput("character_variable"),
  verbatimTextOutput("code"),
  tableOutput("my_tidy_table"),
  DTOutput("my_data_table")
)

server <- function(input, output, session) {
  output$character_text <- renderText({
    glue::glue("These are the names of the {length(mtcars)} variables in `mtcars`")
  })

  output$character_variable <- renderText({
    names(mtcars)
  })

  output$code <- renderPrint({
    aout
  })

  output$my_tidy_table <- renderTable({
    tidy(aout)
  })

  output$my_data_table <- renderDT({
    tidy(aout)
  })
}

shinyApp(ui = ui, server = server)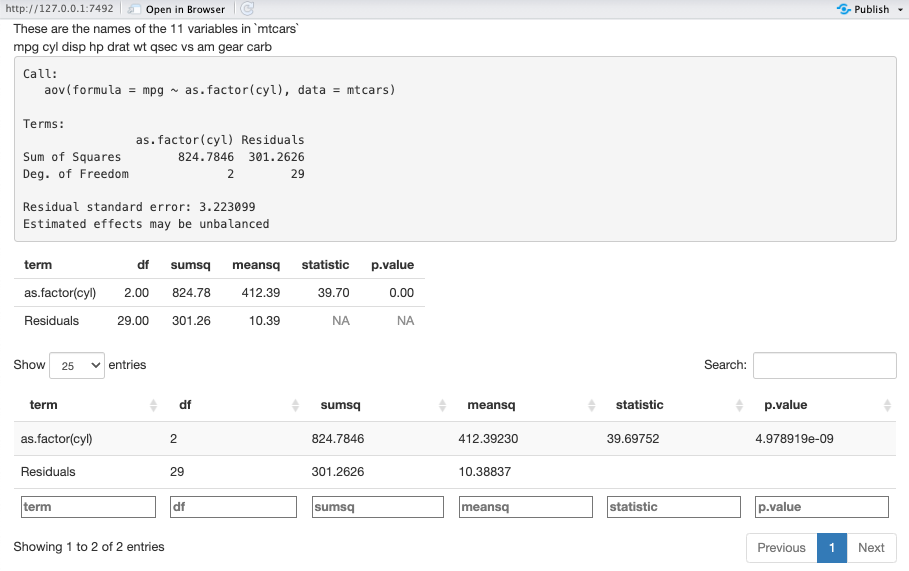
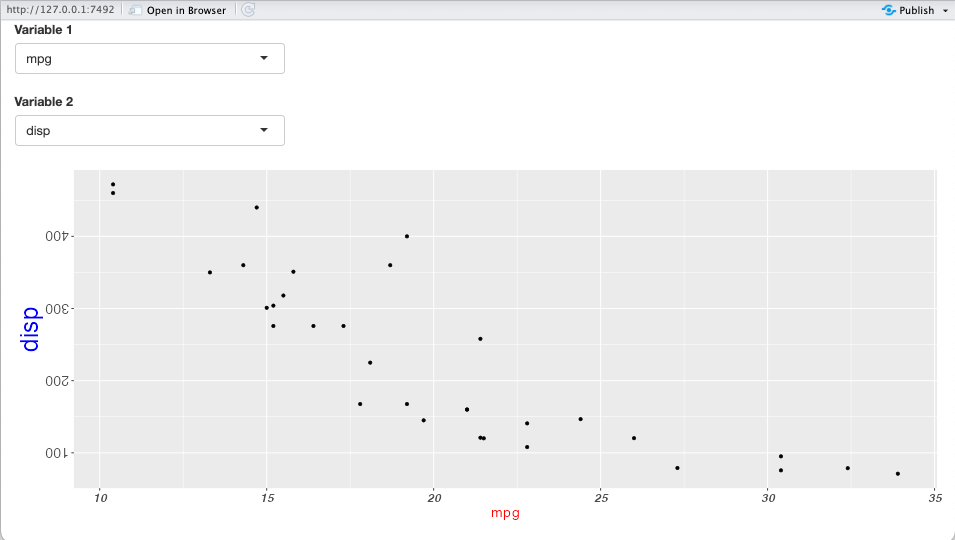
10.6.3 Adjusting Font Size for Plot Axis Titles and Axis Text
Shiny can default to plot axis labels that are too small to read.
The following code is one example of creating a theme as seen in Figure 10.3.
- Note the theme object is created in the business logic section, as a variable you can add to multiple plots instead of typing the same theme code over and over.
We will cover much more about themes later.
library(shiny)
library(ggplot2)

my_theme <- theme(
  axis.title.x = element_text(size = rel(1.5), color = "red"),
  axis.title.y = element_text(size = rel(2.5), color = "blue"),
  axis.text.x = element_text(size = 14, face = "bold.italic"),
  axis.text.y = element_text(size = 16, angle = 180)
)

ui <- fluidPage(
  varSelectInput("var1", "Variable 1", data = mtcars),
  varSelectInput("var2", "Variable 2", data = mtcars),
  plotOutput("plot")
)

server <- function(input, output) {
  output$plot <- renderPlot({
    ggplot(mtcars, aes(x = !!(input$var1), y = !!input$var2)) +
      geom_point() +
      my_theme
  })
}

shinyApp(ui = ui, server = server)