6  Linear Model Selection and Regularization

Author
Affiliation

Richard Ressler

American University

Published

April 16, 2024

6.1 Introduction

Data these days can have thousands, millions, or billions of parameters.

We briefly discussed the “Curse of Dimensionality” with KNN that large data sets with many parameters eventually have to use all the data to get a nearest neighbor.

An approach is to reduce the dimension of the data space.

Two main questions:

  1. What is the problem and how do we measure it?
  2. What are some remedies: Dimension Reduction or Reducing Flexibility?

Specific Methods we will cover:

  • Variable Selection (review from STAT 415/615)
  • Shrinkage Methods - placing a constraint on the parameters
    • Ridge Regression
    • Lasso Regression (Least Absolute Selection and Shrinkage Operator)
  • Principal Components Analysis (PCA)
Regularization

Regularization is a term used to describe methods for making a model simpler and more reliable in prediction - to make it more “regular” and reduce complexity (ornateness?) in the results due to overfitting.

A variety method of methods can be characterized as

  • explicit regularization: e.g., adding penalty functions to “shrink” parameter estimates, or as,
  • implicit regularization, e.g., using specific techniques to reduce overfitting a model such as adopting stopping rules to not always take the “best” model, or eliminating suspicious extreme values as outliers that may not be representative of the true population.

This section will look at how high variance issues can arise and then how to address those issues using explicit regularization methods for reducing predictor variables, reducing the variance of parameter estimates, and shrinking parameter estimates to reduce variance.

6.2 High Dimensional Data and Multicollinearity

Multicollinearity means high correlations among predictor (or independent) variables.

If we have \(Y \sim X_1, X_2, \ldots\), we should be concerned about correlation among the \(X_i\).

  • Increased correlation leads to less and less information coming out of each variable.
  • Increased correlation leads to the least squares algorithm having to choose among similar variables so there is high variance in the \(\beta_i\)s for the correlated variables.

When you fit a linear regression to \(Y \sim X_1 + X_2\),

  • If the \(X_i\) are uncorrelated, you can visualize the axes as being perpendicular.
  • However, the more correlated they are, the smaller angle between the axes.
  • When they are perfectly correlated, the fitted hyper-plane reduces in dimension to become a line.

Let’s compare a full and reduced model

  • Full Model: \(Y = \beta_0 + \beta_1X_1 + \beta_2X_2 + \epsilon\).
  • Reduced Model: \(Y = \beta_0 + \beta_1X_1 + \epsilon\).

Which model is better is an open question.

However, if \(X_1, X_2\) are highly correlated, then the variance of the \(\beta_i\) is high and perhaps we really only need one of the variables.

  • As one example, if we were to create a variable age = 2022 - year in the Auto data frame, the correlation between year and age would be -1 and age would not add any new information to the regression.
  • The Default data set shows a similar issue with the student variable as its correlation with income is .75.

6.2.1 Derivation of the Variance Inflation Factor (VIF)

For simplicity, let’s assume the data has been centered around 0 (each observed value has the sample mean subtracted from it).

  • Centering the data means a regression will pass through the origin so we no longer need the \(\beta_0\) term.

That gives us:

  • Full Model: \(Y = \beta_1X_1 + \beta_2X_2 + \epsilon\).
  • Reduced Model: \(Y = \beta_1X_1 + \epsilon\).

Let’s estimate \(\beta_1\) and compare variances of \(\hat{\beta} = b_1\) in the two models.

With the reduced model, \(b_1\) has the following solution.

\[ b_1 = \frac{S_{x_1 y}}{S_{x_1x_1}} = \frac{\sum x_{1i} y_i}{\sum x_{1i}^2} \]

It has variance (where \(X'=X^T\)):

\[ \text{Var}(b_1) = \sigma^2(X'X)^{-1} = \frac{\sigma^2}{S_{X_1X_1}} \tag{6.1}\]

The solution for the two parameters in the full model is:

\[ \pmatrix{b_1 \\ b_2} = (X'X)^{-1}X'Y \]

and it has the variance-covariance matrix

\[ \text{Var}\pmatrix{b_1 \\ b_2}= \sigma^2(X'X)^{-1} = \sigma^2 \pmatrix{S_{X_1X_1}\,\,S_{X_1X_2} \\ S_{X_2X_1}\,\,S_{X_2X_2}}^{-1} \tag{6.2}\]

where we are using the sums of squares and cross products:

\[ \begin{align} S_{X_1X_1} & = \sum_{i=1}^{n}(x_{1i} - \bar{x}_1)^2\\ S_{X_2X_2} & = \sum_{i=1}^{n}(x_{2i} - \bar{x}_2)^2\\ S_{X_1X_2} & = \sum_{i=1}^{n}(x_{1i} - \bar{x}_1)(x_{2i} - \bar{x}_2) \end{align} \]

We can invert the matrix in Equation 6.2 to get another version of the variance formula.

  • In R, we could use the solve() function.
  • Here, since we have a 2x2 matrix, we can use use the determinant of the matrix to invert as: (Section A.6.3).

\[ \text{Var}\pmatrix{b_1 \\ b_2}= \sigma^2 \pmatrix{S_{X_1X_1}\,S_{X_1X_2} \\S_{X_2X_1}\,S_{X_2X_2}}^{-1} = \frac{\sigma^2}{\underbrace{S_{X_1X_1} S_{X_2X_2} - S^2_{X_1X_2}}_{\text{Determinant}}}\pmatrix{\,\,S_{X_2X_2}\,\,\,-S_{X_1X_2} \\ -S_{X_2X_1}\,\,\,\,S_{X_1X_1}} \tag{6.3}\]

Equation 6.3 is the form of \(\text{Var}\pmatrix{b_1 \\ b_2}\) with the 2x2 matrix inverted.

Now we want to compare the \(\text{Var}(b_1)\) for both models using Equation 6.3 and Equation 6.1.

For the Full model, we just need the top left term in the right-hand side matrix of Equation 6.3 to get \(\text{Var}(b_1^{\text{Full}})\)

\[ \text{Var}(b_1^{\text{Full}}) = \frac{\sigma^2 S_{X_2X_2}}{S_{X_1X_1} S_{X_2X_2} - S^2_{X_1X_2}} \tag{6.4}\]

We can now compare Equation 6.4 and Equation 6.1 and simplify to see how the multicollinearity, the \(\text{cor}(X_1, X_2)\), affects the relative variance of \(b_1\) in the two models.

\[ \begin{align} \frac{\text{Var}(b_1^{\text{Full}})}{\text{Var}(b_1^{\text{Reduced}})} &= \frac{\frac{\sigma^2 S_{X_2X_2}}{S_{X_1X_1} S_{X_2X_2} - S^2_{X_1X_2}}}{\frac{\sigma^2}{S_{X_1X_1}}}\\ \\ & \rightarrow \text{cancel } \sigma^2 \text{ and invert the denominator} \\ \\ &= \frac{ S_{X_2X_2}}{S_{X_1X_1} S_{X_2X_2} - S^2_{X_1X_2}} * S_{X_1X_1} \\ \\ &= \frac{ S_{X_1X_1}S_{X_2X_2}}{S_{X_1X_1} S_{X_2X_2} - S^2_{X_1X_2}} \\ \\ & \rightarrow \text{divide top and bottom by the numerator} \\ &= \frac{1}{1- \frac{S^2_{X_1X_2}}{S_{X_1X_1}S_{X_2X_2}}} \\ \\ & \rightarrow \text{convert to sums of squares} \\ &= \frac{1}{1- \bigg(\underbrace{\frac{\sum (X_{1i} - \bar{X}_{1})\sum (X_{2i} - \bar{X}_{2})}{\sqrt{\sum (X_{1i} - \bar{X}_{1})^2}\sqrt{\sum (X_{2i} - \bar{X}_{2})^2}}}_{\frac{\text{Cov}(X_1X_2)}{\text{StdDev}(X_1)\text{StdDev}(X_2)} = r}\bigg)^2} \\ \\ & \rightarrow \text{substitute in } r \\ &= \frac{1}{1-r^2} \end{align} \tag{6.5}\]

Note: One can divide the numerator and denominator of the squared term in the denominator of Equation 6.5 by \((n-1)\)) to get the standard form of the squared correlation coefficient \(r^2\).

This ratio of variances is the Variance Inflation Factor.

\[ \frac{\text{Var}(b_1^{\text{Full}})}{\text{Var}(b_1^{\text{Reduced}})} = \frac{1}{1-r^2} \equiv\text{VIF} \tag{6.6}\]

VIF

\(\text{VIF} \geq 1\) for all \(r^2\).

Let’s look at two extreme cases for the VIF.

  1. What happens if \(r = \pm 1\) so there is perfect correlation?
  • Then \((X'X)\) is not invertible and the variance of \(\text{VAR}(b_1^\text{Full}) =\infty\).
  1. What happens if \(r^2 = 0\)?
  • \(X_1, X_2\) are uncorrelated \(\iff \text{VIF} = 1\) so no difference in the variances of the parameters between the two models.
  • The variances are the minimum; the best case.

Minimizing the correlation between predictor variables is a goal of experimental design.

  • Design your experiments using random selections of variables with balanced samples so the \(X_i\), \(X_j\) are orthogonal \(\iff R^2_{ij} = 0\).

When we don’t have orthogonal predictors, the usual case in real world data, we can try to transform them to new variables that are perfectly orthogonal by construction.

  • This is the rationale for doing Principal Component Analysis which we will see in a bit.

6.2.2 Multi-dimensional VIF

We just looked at an example comparing a one-dimensional/predictor model with a two dimensional/predictor model.

For higher dimensions we want to look at the variance inflation factor for the \(j\)th predictor:

\[ \text{VIF}_j = \frac{\text{Var}(b_{k\neq j}^{\text{Full}})}{\text{Var}(b_{k\neq j}^{\text{without}(X_j)})} = \frac{1}{1-R_j^2} \]

We have to measure how well can \(X_j\) be predicted by the other variables.

We define \(R_j^2\) as the \(R^2\) from the linear regression of

\[ X_j = \gamma_1 X_1 + \cdots + \gamma_{p-1} X_{p-1} +\epsilon \quad(\text{ without} X_j) \]

  • We are not concerned about the original response \(Y\) as VIF only depends upon the relationships among the \(X_i\).

6.2.3 Examples of VIF using R

Let’s use the HOME SALES.csv data.

Show code
suppressMessages(library(tidyverse))
home <- read_csv("https://raw.githubusercontent.com/rressler/data_raw_courses/main/HOME_SALES.csv")
glimpse(home)
Rows: 522
Columns: 13
$ ID              <dbl> 1, 2, 3, 4, 5, 6, 7, 8, 9, 10, 11, 12, 13, 14, 15, 16,…
$ SALES_PRICE     <dbl> 360000, 340000, 250000, 205500, 275500, 248000, 229900…
$ FINISHED_AREA   <dbl> 3032, 2058, 1780, 1638, 2196, 1966, 2216, 1597, 1622, …
$ BEDROOMS        <dbl> 4, 4, 4, 4, 4, 4, 3, 2, 3, 3, 7, 3, 5, 5, 3, 5, 2, 3, …
$ BATHROOMS       <dbl> 4, 2, 3, 2, 3, 3, 2, 1, 2, 3, 5, 4, 4, 4, 3, 5, 2, 4, …
$ GARAGE_SIZE     <dbl> 2, 2, 2, 2, 2, 5, 2, 1, 2, 1, 2, 3, 3, 2, 2, 2, 2, 2, …
$ YEAR_BUILT      <dbl> 1972, 1976, 1980, 1963, 1968, 1972, 1972, 1955, 1975, …
$ STYLE           <dbl> 1, 1, 1, 1, 7, 1, 7, 1, 1, 1, 7, 1, 7, 5, 1, 6, 1, 7, …
$ LOT_SIZE        <dbl> 22221, 22912, 21345, 17342, 21786, 18902, 18639, 22112…
$ AIR_CONDITIONER <chr> "YES", "YES", "YES", "YES", "YES", "YES", "YES", "YES"…
$ POOL            <chr> "NO", "NO", "NO", "NO", "NO", "YES", "NO", "NO", "NO",…
$ QUALITY         <chr> "MEDIUM", "MEDIUM", "MEDIUM", "MEDIUM", "MEDIUM", "MED…
$ HIGHWAY         <chr> "NO", "NO", "NO", "NO", "NO", "NO", "NO", "NO", "NO", …

Let’s predict sales price based on the full model (without ID).

Show code
reg <- lm(SALES_PRICE ~ . - ID, data = home)

We can use the {car} package (Companion to Applied Regression) to extract variance inflation factors for the variables.

Show code
library(car)
vif(reg)
                    GVIF Df GVIF^(1/(2*Df))
FINISHED_AREA   4.329317  1        2.080701
BEDROOMS        1.664883  1        1.290303
BATHROOMS       3.158799  1        1.777301
GARAGE_SIZE     1.660364  1        1.288551
YEAR_BUILT      1.922476  1        1.386534
STYLE           1.831000  1        1.353145
LOT_SIZE        1.176794  1        1.084801
AIR_CONDITIONER 1.390599  1        1.179236
POOL            1.052163  1        1.025750
QUALITY         3.541208  2        1.371791
HIGHWAY         1.029402  1        1.014595

The second column contains the VIF values.

  • The G is for Generalized which means that if you have categorical predictors, it will account for the different levels (the dummy variables).
  • Here we see Quality has 2 degrees of freedom since there are three levels: 68, 164, 290

How to interpret the GVIF?

  • Having FINISHED_AREA in the model will inflate the variances of all the other variables by 4.3.

How was it computed?

  • By regressing FINISHED_AREA on all the other variables except the response SALES_PRICE and ID which we left out of the Full model.
Show code
reg_vif <- lm(FINISHED_AREA ~ . -ID - SALES_PRICE, data = home)
summary(reg_vif)

Call:
lm(formula = FINISHED_AREA ~ . - ID - SALES_PRICE, data = home)

Residuals:
     Min       1Q   Median       3Q      Max 
-1072.87  -223.39   -25.81   171.32  1685.87 

Coefficients:
                     Estimate Std. Error t value Pr(>|t|)    
(Intercept)         4.386e+03  2.338e+03   1.876   0.0612 .  
BEDROOMS            1.013e+02  1.872e+01   5.410 9.72e-08 ***
BATHROOMS           1.863e+02  2.389e+01   7.796 3.61e-14 ***
GARAGE_SIZE         1.158e+02  2.937e+01   3.943 9.19e-05 ***
YEAR_BUILT         -1.501e+00  1.188e+00  -1.264   0.2068    
STYLE               8.830e+01  6.968e+00  12.672  < 2e-16 ***
LOT_SIZE            2.950e-03  1.399e-03   2.109   0.0354 *  
AIR_CONDITIONERYES -1.138e+01  4.762e+01  -0.239   0.8112    
POOLYES             5.446e+01  6.115e+01   0.891   0.3735    
QUALITYLOW         -7.964e+02  7.598e+01 -10.481  < 2e-16 ***
QUALITYMEDIUM      -6.658e+02  5.435e+01 -12.250  < 2e-16 ***
HIGHWAYYES          7.633e-01  1.068e+02   0.007   0.9943    
---
Signif. codes:  0 '***' 0.001 '**' 0.01 '*' 0.05 '.' 0.1 ' ' 1

Residual standard error: 345.4 on 510 degrees of freedom
Multiple R-squared:  0.769, Adjusted R-squared:  0.764 
F-statistic: 154.4 on 11 and 510 DF,  p-value: < 2.2e-16

We can calculate the VIF of FINISHED_AREA as

Show code
1/(1 - summary(reg_vif)$r.squared)
[1] 4.329317

The VIF shows how well FINISHED_AREA could be predicted by the other variables in the data. While not perfect correlation, it is pretty high.

Note

A VIF of 4 is generally considered okay.

  • 5-10 should be noted, and
  • \(VIF \geq 10\) should be avoided.

Example with mtcars.

Show code
vif(lm(mpg ~ ., data = mtcars))
      cyl      disp        hp      drat        wt      qsec        vs        am 
15.373833 21.620241  9.832037  3.374620 15.164887  7.527958  4.965873  4.648487 
     gear      carb 
 5.357452  7.908747 

Note that cyl will inflate variance of other slopes by 15 and displ will inflate by 21.

Check the \(R^2\) for disp when fit to the other variables.

Show code
summary(lm(disp ~ . - mpg, data = mtcars))$r.squared
[1] 0.953747

disp can be predicted quite closely by the other variables. It will not add much information to the original model and inflates the variances of the other predictor parameters.

We see that high dimensions and multicollinearity can be a problem in inflating the variance in our estimates.

We will now look at possible remedies.

6.3 Dimension Reduction

Reducing:

  • dimension, size, time
  • flexibility
  • multicollinearity, which inflates the variance (increases the size of the confidence intervals).

Methods:

  1. Variable Selection (quick review) 
  2. Shrinkage - Ridge Regression, Lasso Regression
  3. Principal Components - create new, uncorrelated, variables that capture the maximum information from the data in an efficient way. (Face Recognition Example)

6.4 Variable Selection in R

Two main approaches

  • Exhaustive Search: Looking at all possible models
  • Sequential Search

6.4.2 Metrics for Comparing Models

6.4.2.1 How about Adjusted R-Squared, adjr2?

Show code
suppressMessages(library(tidyverse))
df <- data.frame(adjR2 = reg_ex_summary$adjr2, nvar = 1:length(reg_ex_summary$adjr2))
ggplot(df, (aes(nvar, adjR2))) +
  geom_line()

Which number of variables has the largest adjr2?

which.max(reg_ex_summary$adjr2)
[1] 10

So on the basis of adjusted R-Squared we would use 10 variables. We can see which ten from the summary where the value is TRUE.

reg_ex_summary$which[10,][-1] # drop the intercept term
     FINISHED_AREA           BEDROOMS          BATHROOMS        GARAGE_SIZE 
              TRUE               TRUE               TRUE               TRUE 
        YEAR_BUILT              STYLE           LOT_SIZE AIR_CONDITIONERYES 
              TRUE               TRUE               TRUE              FALSE 
           POOLYES         QUALITYLOW      QUALITYMEDIUM         HIGHWAYYES 
             FALSE               TRUE               TRUE               TRUE 

Looking at the plot, do you think 10 variables would be the best model by other criteria?

6.4.2.2 BIC

Let’s look at BIC (Bayesian Information Criterion)

  • We prefer lower values of BIC when comparing models.
round(reg_ex_summary$bic,0)
 [1] -569 -642 -785 -811 -850 -865 -863 -861 -859 -855 -849 -843
which.max(reg_ex_summary$bic) # The worst by BIC
[1] 1
which.min(reg_ex_summary$bic) # The best by BIC
[1] 6
reg_ex_summary$which[6,][reg_ex_summary$which[6,] == TRUE][-1]
FINISHED_AREA    YEAR_BUILT         STYLE      LOT_SIZE    QUALITYLOW 
         TRUE          TRUE          TRUE          TRUE          TRUE 
QUALITYMEDIUM 
         TRUE 
  • We can create a linear model from the output.
    • We have to adjust for the categorical variable to remove the dummy variables and add back in the original predictor.
Show code
pred_names <- reg_ex_summary$which[6,][reg_ex_summary$which[6,] == TRUE][-1] |> 
  names()
pred_names <- pred_names[1:4]
my_formula <- str_c("SALES_PRICE", 
                    str_flatten(c(pred_names, "QUALITY"), collapse = " + "),
                    sep = " ~ ")
lm_bic <- lm(formula(my_formula), data = home)
summary(lm_bic)

Call:
lm(formula = formula(my_formula), data = home)

Residuals:
    Min      1Q  Median      3Q     Max 
-234308  -28196   -2578   24361  273806 

Coefficients:
                Estimate Std. Error t value Pr(>|t|)    
(Intercept)   -2.596e+06  3.753e+05  -6.916 1.38e-11 ***
FINISHED_AREA  1.110e+02  6.368e+00  17.428  < 2e-16 ***
YEAR_BUILT     1.389e+03  1.886e+02   7.366 7.04e-13 ***
STYLE         -6.167e+03  1.327e+03  -4.647 4.28e-06 ***
LOT_SIZE       1.405e+00  2.292e-01   6.131 1.74e-09 ***
QUALITYLOW    -1.497e+05  1.351e+04 -11.080  < 2e-16 ***
QUALITYMEDIUM -1.368e+05  1.014e+04 -13.494  < 2e-16 ***
---
Signif. codes:  0 '***' 0.001 '**' 0.01 '*' 0.05 '.' 0.1 ' ' 1

Residual standard error: 58090 on 515 degrees of freedom
Multiple R-squared:  0.8247,    Adjusted R-squared:  0.8226 
F-statistic: 403.7 on 6 and 515 DF,  p-value: < 2.2e-16

6.4.2.3 Mallows \(Cp\)

How about Mallow’s \(Cp\)?

  • A good fit is when \(Cp\) is close to \(p\), the number of variables (predictors) in the model.
  • A value of \(Cp\) close to \(p\) means the model is relatively precise, with low bias. It works best for large sample sizes.
  • \(Cp\) is useful for evaluating subsets of predictors as the \(Cp\) always equals \(p+1\) (the number of parameters or \(\beta\)s including \(\beta_0\)) for a full model.
    • \(Cp\) tries to balance overfitting and underfitting. If a model is underfit (due to insufficient predictors), the bias is higher and if it is overfit (too many predictors), the variance is higher.
    • When fitting a full model, with all the possible predictors, it is assumed the model is as unbiased as possible. That is why \(Cp=p+1\) so it does not tell you much.
  • So \(Cp\) is useful for finding a good model that does not use all the predictors. If it uses all the predictors, then \(Cp=p+1\) is not as helpful.
Note

Sources use different definitions for \(Cp\) but they all lead to the same choices when comparing models.

  • Some define \(p\) as the number of parameters, \(\beta_0, \beta_1, \beta_2, \ldots, \beta_{p-1}\) where the number of parameters is 1 more than the number of predictor variables.
  • Some define \(p\) as the number of predictor variables. (We will use this one.)

Use \(Cp\) to find the model where \(Cp\) is close to the number of predictors (or the number of parameters -1).

Be sure to check the definition of \(p\) when reading different sources.

To find the best model base on \(Cp\), subtract the number of predictors (not coefficients) in the model, take the absolute value, and check which model has the smallest remainder.

  • Remember the predictor variables “in the model” includes any dummy variables for factors so here the maximum is 12.
round(reg_ex_summary$cp, 2)
 [1] 464.46 326.73 119.16  83.35  36.43  16.44  13.74  11.71  10.11   9.76
[11]  11.10  13.00
which.max(abs(reg_ex_summary$cp - 1:12)) # The worst by Cp - underfit so high bias.
[1] 1
which.min(abs(reg_ex_summary$cp - 1:12)) # The best by Cp
[1] 11
names(reg_ex_summary$which[11,][reg_ex_summary$which[11,] == TRUE])[-1]
 [1] "FINISHED_AREA" "BEDROOMS"      "BATHROOMS"     "GARAGE_SIZE"  
 [5] "YEAR_BUILT"    "STYLE"         "LOT_SIZE"      "POOLYES"      
 [9] "QUALITYLOW"    "QUALITYMEDIUM" "HIGHWAYYES"   

The value of \(Cp\) for 12 predictors is \(13 = p+1\) so we are not interested in that one. Is there another model where \(|(Cp-p)|\) is close to 0?

  • Note: the count of 11 includes the two dummy variables for QUALITY so we are actually using 10 of the original 11 variables (we dropped ID).

We can plot \(Cp\) as well against the number of predictors in the model.

Show code
ggplot(data.frame(x = 1:12, Cp = reg_ex_summary$cp), aes(x, Cp)) +
  geom_point() +
  xlab("Number of predictors in the model, including dummy variables") +
  geom_abline(slope = 1, intercept  = 0, color = "red", lty = 2)  +
  ylim(0, 13) + scale_x_continuous(breaks = seq(0, 12, by = 1))

6.4.2.4 Summary

Which model would you chose so far?

So that is Exhaustive search; looking at all the possible models.

Would it work for 100 or 1,000 predictors?

6.5 Ridge Regression

  1. We want to reduce multicollinearity.
  2. We want to reduce the variance of the estimates.

Given our estimates \(\vec{b} = (X'X)^{-1}X'Y\), if the \(X\) variables are highly-correlated, the \(\text{det}(X'X)\) will be close to 0.

  • If we use \((X'X)\) to multiply a vector, that transformed vector will enclose a volume of \(p\) dimensions.
  • We can consider the value of \(\text{det}(X'X)\) as the factor by which the matrix \((X'X)\) will shrink or grow the volume enclosed by the transformed vector compared to the original vector.
  • If \(\text{det}(X'X)\) is close to 0, close to singularity, the volume of the new transformed space is close to 0.
    • A value of 0 collapses the space for the solutions so they have to fit into a space with dimension \(p-1\).
    • If \(p=3\), we can think of a matrix with \(\text{det}(X'X)= 0\) as forcing the solutions to be on a plane.

Ridge Regression is method to add “something” to the matrix to move it away from singularity.

Ridge Regression replaces the standard \((X'X)\) matrix with \(\big(X'X + \lambda I\big)\) where

  • \(\lambda\) is the Ridge Parameter; the “something” that gets added, (it’s a tuning parameter)

  • \(\lambda\geq0\), and,

  • \(I\) is an identity matrix \({\scriptstyle\begin{bmatrix}1, 0, 0 \\ 0, 1, 0\\0, 0, 1\end{bmatrix}}\) which is easily invertible as \(I' = I\).

  • The larger \(\lambda\), the more we add to the diagonal of \(X'X\), and the more we are moving the determinant of \(X'X\) away from 0, e.g., to 3 dimensions from a 2-d plan

Given \(p\) predictors, a singular \((X'X)\) is known as a “flat matrix” as moves the solutions to a \(p-1\) dimensional subspace of the \(p\) parameters.

Adding the Ridge Parameter can be visualized as increasing the output dimension of \((X'X)\) by building a “ridge” of height \(\lambda\) into the \(p^\text{th}\) dimension.

  • If you had a number line and added vertical noise, you now have a 2-dimensional space.

  • If you had two vectors \(a = (1, 2, 3)\) and \(b = (2, 4, 6)\) they would be perfectly correlated.

  • If you added .5 to each value, \(a* = (1.5, 2.5, 3.5)\) and \(b* = (2.5, 4.5, 6.5)\) would not be as correlated.

Under Ridge Regression the solution for the slope parameters is now

\[ \vec{b} = (X'X + \lambda I)^{-1}X'Y \tag{6.9}\]

You could think of this for now as an empirical approach towards reducing risks of singularity by adding the \(\lambda\) to the flat matrix.

6.5.1 Matrix Versions of Full and Reduced Models

Let’s consider a Full Model with two matrices of predictors, \(\bf{X}_1\) for variables we think are of interest, and \(\bf{X}_2\) with other possible variables.

  • Note: the \(\bf{X}_1\) matrix includes, as the first column, 1’s to represent the intercepts and \(\vec{\beta}_1\) has \(\beta_0\) as its first element.

\[Y = \bf{X}_1\vec{\beta}_1 + \bf{X}_2\vec{\beta}_2 + \epsilon \tag{6.10}\]

A reduced model results from eliminating the potential variables in \(\bf{X}_2\) to reduce the dimensionality (and chances for variance inflation due to multicollinearity).

\[Y = \bf{X}_1\vec{\beta}_1 + \epsilon \tag{6.11}\]

Two Observations:

  1. If the Full Model is correct (the true relationship) and we are using the Reduced Model, the estimates \(\vec{\hat{\beta}}^\text{Reduced}_1\) will be biased (underfitting, too restrictive).

  2. If the Reduced Model is correct and we are using the Full Model, then the true \(\vec{\hat{\beta}}^\text{Full}_2 = 0\) and the full vector of \(\vec{\hat{\beta}} = \begin{bmatrix}\vec{\hat{\beta}}^\text{Full}_1 \\ \vec{\hat{\beta}}^\text{Full}_2\end{bmatrix}\) estimates \(\begin{bmatrix}\vec{\beta}_1 \\ \vec{0}\end{bmatrix}\).

  • It is still unbiased and linear, but it is not the best linear unbiased estimate (BLUE), with the lowest variance (overfitting, too flexible).

If the Reduced Model is correct, then \(\vec{\hat{\beta}}^\text{Reduced}_1\) is BLUE.

  • Since \(\vec{\hat{\beta}}^\text{Full}_1\) is a different estimator, it cannot be as good.
  • That means our too-flexible method has increased variance.

\[ \text{Var}\left(\vec{\hat{\beta}}^\text{Full}_1\right) > \text{Var}\left(\vec{\hat{\beta}}^\text{Reduced}_1\right) \]

Important

Conclusion: For many possible predictors, it is still true: too few variables increases bias; too many variables increases variance.

6.5.2 Ridge Regression as a Shrinkage Method

In Equation 6.9, the \(\lambda\) term is added to reduce multicollinearity.

\[ \vec{b} = (X'X \underbrace{+ \lambda I}_{\text{Added to reduce }\\ \text{multicollinearity}})^{-1}X'Y \tag{6.12}\]

However, we will see it also solves the constrained optimization problem used to shrink the parameters.

  • Any least squares method is an optimization problem.
  • The objective function for least squares regression is the error sum of squares and we want to minimize it.

\[\text{SSErr} = \sum(\hat{y}_i - y_i)^2 \tag{6.13}\]

Ridge regression is a method we can use when we are concerned about the potential for high variance in the estimates of the slope parameters \(\hat{\beta}_i = b_i\).

The approach is to constrain the values of the \(b_i\) so they do not get too large. We want to shrink them from the standard least squares regression values.

  • We want to reduce the amount by which \(\hat{y}_i\) changes with a change in the \(\vec{b}\).

For Ridge Regression, we add the following constraint to the optimization where \(\gamma\geq 0\) is some number we can choose:

\[||\vec{b^2}||_{2} = \sum_{j=1}^{p}b_j^2 \leq \gamma \tag{6.14}\]

This equation defines a constraint on the values of the \(b_i\)s based on the \(L_2\) norm.

6.5.3 Shape of the Constraint Function for Ridge Regression

What is the shape of the space created by the equation Equation 6.14?

Let’s consider when \(p=2\) so we have a plane with \(b_1\) on the \(X\) axis and \(b_2\) on the \(Y\) axis.

\(b_1^2 +b_2^2\) is the \(L_2\) norm for Euclidean distance, or squared distance.

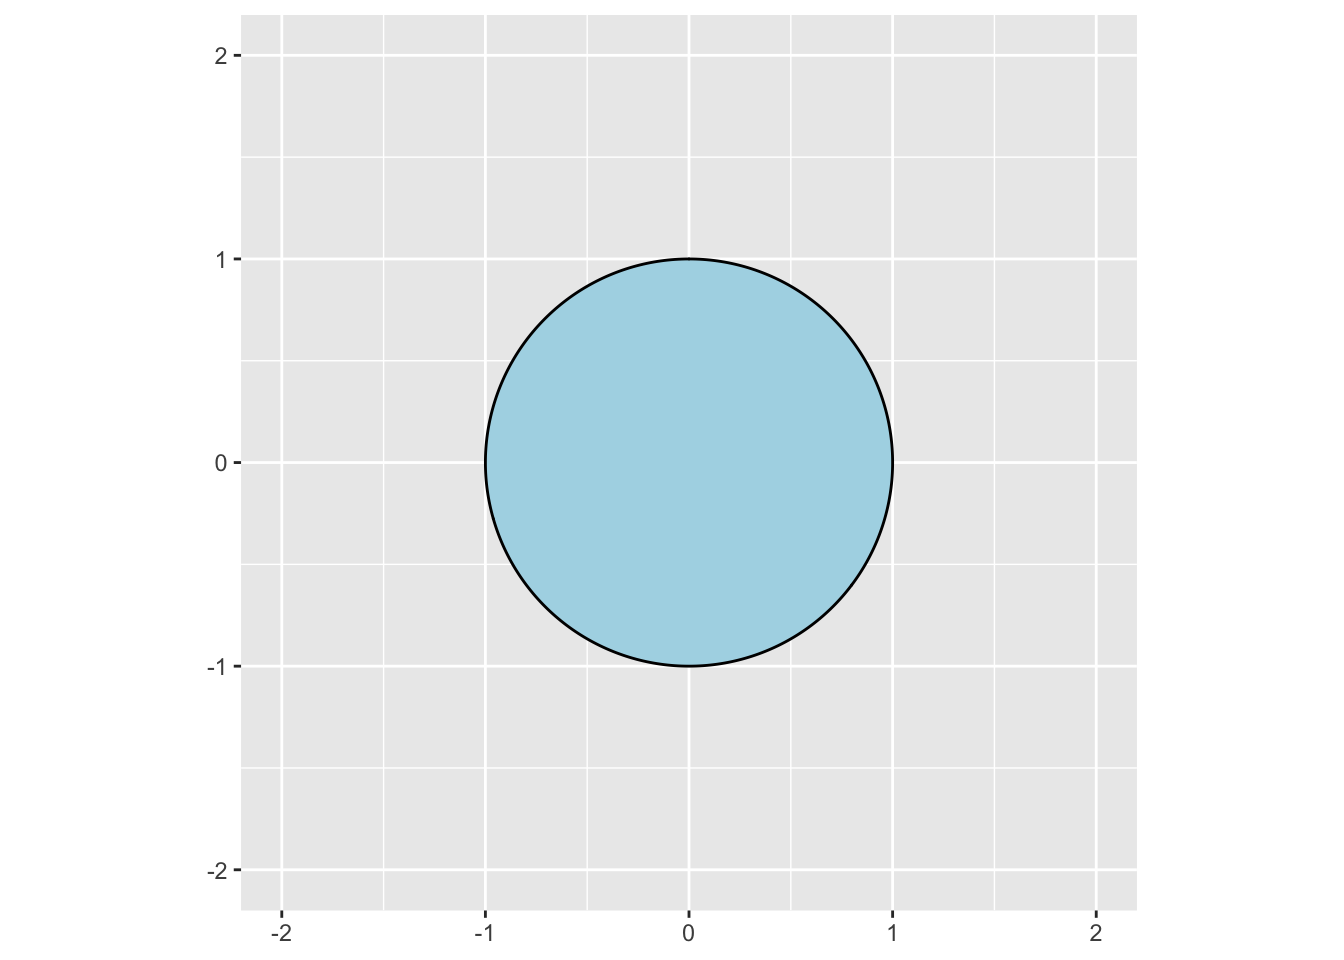
When \(b_1^2 + b_2^2 = \gamma\), that defines a familiar shape:

Show code
library(tidyverse)
library(ggforce)
circles <- data.frame(
  b1 = 0,
  b2 = 0,
  r = 1
)
ggplot() +
  geom_circle(aes(x0 = b1, y0 = b2, r = r), fill = "lightblue", data = circles) +
  coord_fixed() +
  ylim(-2, 2) +
  xlim(-2, 2)
Figure 6.1: The constrained region for gamma of 1

When \(b_1^2 +b_2^2 < \gamma\), \(b_1^2\) and \(b_2^2\) must be in the interior of the shape.

When \(p\geq 3\), the constraint forms a hyper-sphere.

6.5.3.1 Shape of the Objective Function

What about the shape of the function for SSE?

  • This is what we want to minimize.

\[\text{SSErr} = \sum(y_i-\hat{y}_i)^2 = \sum(y_i - (b_0 + b_1 x_1 + b_2 x_2 + \cdots))^2\]

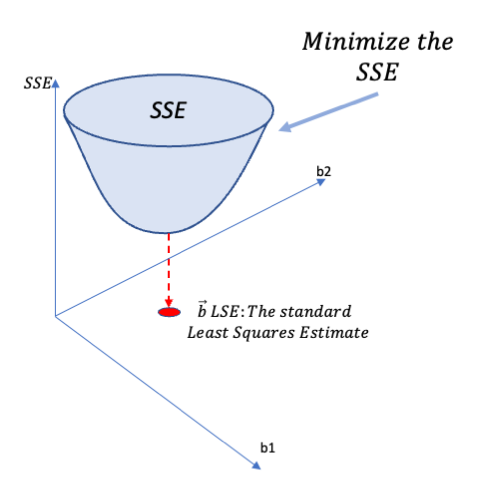
This is a more complicated figure: a quadratic polynomial of \(b_j\) with positive coefficients at each \(b_j^2\) which means it is a parabaloid in \(p\) dimensions.

In \(p=2\) we can visualize it as

Figure 6.2: Minimizing the SSE parabaloid.

6.5.3.2 Visualizing the Solution to the Ridge Regression Constrained Optimization Function

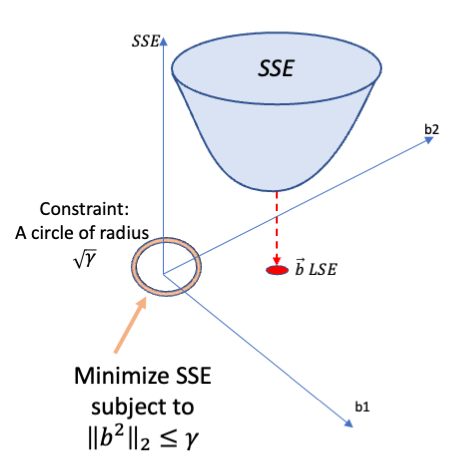
When we add the constraint on the \(b_j\)s, that may or may not change the LSE solution for the estimates.

  • Here the constraint does not include the LSE solution so we have to find a new solution.
Figure 6.3: Adding a constraint on the b’s may change the solution.

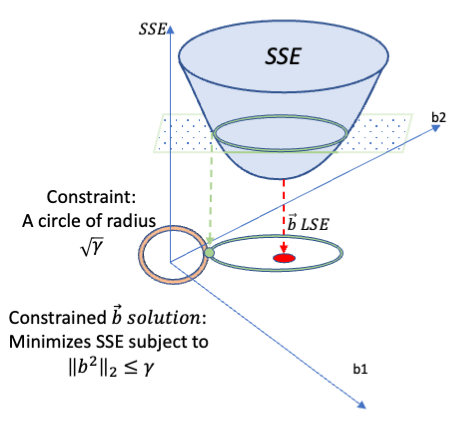
Visualize adding a plane that is horizontal to the plane formed by \(b_1\) and \(b_2\).

  • This plane will intersect the parabaloid in the shape of an ellipse, as the \(b_1\) and \(b_2\) will generally have different coefficients \(X_1\) and \(X_2\).
  • Project the ellipse down onto the plane formed by \(b_1\) and \(b_2\).
  • Raise the plane until the projected ellipse intersects with the constraint circle.
  • The point of intersection is the new solution for \(\vec{b}\); it minimizes the SSE while ensuring the constraint is met.
Figure 6.4: Minimizing the SSE parabaloid by using a plane to find the new minimum.

Another way to think about it:

  • Project the circle into the upper dimension (create a cylinder).
  • Where the cylinder first intersects the parabaloid is the solution for the \(\beta_j\)s.

What happens if \(\gamma = 0\)?

Figure 6.4 provides the context for how we can derive the solution.

6.5.4 Deriving the Solution for \(\vec{b}\) under the Constraint

In calculus, we solve an unconstrained optimization by taking the partial derivatives and setting them equal to 0 and solving the equations.

  • We know the value will be at an extreme point or an edge.
  • Here, we don’t have a single extreme point or an edge.

We can use Lagrange Multipliers to solve a constrained optimization function.

  • The concept is to add the constraint to the optimization function with the Lagrange Multiplier, \(\lambda\), (what we would call a tuning factor) to serve as a penalty weight for the constraint.

To minimize the function \(f(x) = \text{SSE}(\vec{b})\) subject to the constraint \(||\vec{b^2}||_2 = \sum_{j=1}^{p}b_j^2 \leq \gamma\), we minimize the following:

\[\begin{align} \text{Minimize }Q(\vec{b}) &= SSE(\vec{b}) + \lambda ||\vec{b^2}||_2^2\\\\ &= \sum(y_i - b_0 - b_1 x_{i1} - b_2 x_{i2} - \cdots)^2 + \lambda\sum b_i^2\\ \\ &\text{take the partial derivative} \rightarrow \text{ and set = 0}\\\\ \frac{\partial Q}{\partial b_j}&= 2\sum(y_i - b_0 - b_1 x_{i1} - b_2 x_{i2} - \cdots)x_{ij} + \lambda 2 b_j = 0 \\ \\ &\text{Divide by 2 for simplicity } \rightarrow \text{ and convert to matrix form}\\\\ &= -\bf{X'}Y + \bf{X'}\bf{X}b + \lambda\vec{b} = 0 \\\\ &\text{Solve for }\vec{b} \rightarrow \text{Use Identity matrix to redimension }\lambda \\\\ \bf{X'}\bf{X}b + \lambda\vec{b}&= \bf{X'}Y \\ (\bf{X'}\bf{X} + \lambda I)\vec{b}&= \bf{X'}Y \\\\ &\text{Solve for }\vec{b} \rightarrow \text{Invert the matrix }\\\\ \vec{b} &= (\bf{X'}\bf{X}+ \lambda I)^{-1}\bf{X'}Y \rightarrow \text{ The Ridge Regression solution} \end{align} \tag{6.15}\]

Important

This is the solution we saw in Equation 6.9 for reducing multicollinearity.

We now see it is the same solution for reducing the variance of the estimates by shrinking the slopes so their \(L_2\) norm fits within the constraint (circle).

6.5.5 Example: Ridge Regression in R with {MASS}

Let’s use the Boston data set from {MASS}.

library(tidyverse)
library(MASS)

Did you notice which function gets masked?

Let’s look at the individual variables and their pairwise correlations.

glimpse(Boston)
Rows: 506
Columns: 14
$ crim    <dbl> 0.00632, 0.02731, 0.02729, 0.03237, 0.06905, 0.02985, 0.08829,…
$ zn      <dbl> 18.0, 0.0, 0.0, 0.0, 0.0, 0.0, 12.5, 12.5, 12.5, 12.5, 12.5, 1…
$ indus   <dbl> 2.31, 7.07, 7.07, 2.18, 2.18, 2.18, 7.87, 7.87, 7.87, 7.87, 7.…
$ chas    <int> 0, 0, 0, 0, 0, 0, 0, 0, 0, 0, 0, 0, 0, 0, 0, 0, 0, 0, 0, 0, 0,…
$ nox     <dbl> 0.538, 0.469, 0.469, 0.458, 0.458, 0.458, 0.524, 0.524, 0.524,…
$ rm      <dbl> 6.575, 6.421, 7.185, 6.998, 7.147, 6.430, 6.012, 6.172, 5.631,…
$ age     <dbl> 65.2, 78.9, 61.1, 45.8, 54.2, 58.7, 66.6, 96.1, 100.0, 85.9, 9…
$ dis     <dbl> 4.0900, 4.9671, 4.9671, 6.0622, 6.0622, 6.0622, 5.5605, 5.9505…
$ rad     <int> 1, 2, 2, 3, 3, 3, 5, 5, 5, 5, 5, 5, 5, 4, 4, 4, 4, 4, 4, 4, 4,…
$ tax     <dbl> 296, 242, 242, 222, 222, 222, 311, 311, 311, 311, 311, 311, 31…
$ ptratio <dbl> 15.3, 17.8, 17.8, 18.7, 18.7, 18.7, 15.2, 15.2, 15.2, 15.2, 15…
$ black   <dbl> 396.90, 396.90, 392.83, 394.63, 396.90, 394.12, 395.60, 396.90…
$ lstat   <dbl> 4.98, 9.14, 4.03, 2.94, 5.33, 5.21, 12.43, 19.15, 29.93, 17.10…
$ medv    <dbl> 24.0, 21.6, 34.7, 33.4, 36.2, 28.7, 22.9, 27.1, 16.5, 18.9, 15…
abs(round(cor(Boston), 2))
        crim   zn indus chas  nox   rm  age  dis  rad  tax ptratio black lstat
crim    1.00 0.20  0.41 0.06 0.42 0.22 0.35 0.38 0.63 0.58    0.29  0.39  0.46
zn      0.20 1.00  0.53 0.04 0.52 0.31 0.57 0.66 0.31 0.31    0.39  0.18  0.41
indus   0.41 0.53  1.00 0.06 0.76 0.39 0.64 0.71 0.60 0.72    0.38  0.36  0.60
chas    0.06 0.04  0.06 1.00 0.09 0.09 0.09 0.10 0.01 0.04    0.12  0.05  0.05
nox     0.42 0.52  0.76 0.09 1.00 0.30 0.73 0.77 0.61 0.67    0.19  0.38  0.59
rm      0.22 0.31  0.39 0.09 0.30 1.00 0.24 0.21 0.21 0.29    0.36  0.13  0.61
age     0.35 0.57  0.64 0.09 0.73 0.24 1.00 0.75 0.46 0.51    0.26  0.27  0.60
dis     0.38 0.66  0.71 0.10 0.77 0.21 0.75 1.00 0.49 0.53    0.23  0.29  0.50
rad     0.63 0.31  0.60 0.01 0.61 0.21 0.46 0.49 1.00 0.91    0.46  0.44  0.49
tax     0.58 0.31  0.72 0.04 0.67 0.29 0.51 0.53 0.91 1.00    0.46  0.44  0.54
ptratio 0.29 0.39  0.38 0.12 0.19 0.36 0.26 0.23 0.46 0.46    1.00  0.18  0.37
black   0.39 0.18  0.36 0.05 0.38 0.13 0.27 0.29 0.44 0.44    0.18  1.00  0.37
lstat   0.46 0.41  0.60 0.05 0.59 0.61 0.60 0.50 0.49 0.54    0.37  0.37  1.00
medv    0.39 0.36  0.48 0.18 0.43 0.70 0.38 0.25 0.38 0.47    0.51  0.33  0.74
        medv
crim    0.39
zn      0.36
indus   0.48
chas    0.18
nox     0.43
rm      0.70
age     0.38
dis     0.25
rad     0.38
tax     0.47
ptratio 0.51
black   0.33
lstat   0.74
medv    1.00

We can see some high correlations.

Let’s predict medv, the median price of houses, and use ridge regression to reduce the variance of the estimates.

  • We will use MASS::lm.ridge().
  • Note: the default value of \(\lambda\) is lambda = 0.
  • This produces the standard Least Squared Error estimates.
lm.ridge(medv ~ ., data = Boston)$coef |> round(2) 
   crim      zn   indus    chas     nox      rm     age     dis     rad     tax 
  -0.93    1.08    0.14    0.68   -2.06    2.67    0.02   -3.10    2.66   -2.08 
ptratio   black   lstat 
  -2.06    0.85   -3.74 

Let’s pick a \(\lambda\). We do not know the optimal value but can choose it later using cross-validation.

  • Let’s start with lambda = 3.
lm.ridge(medv ~ ., lambda = 3, data = Boston)$coef |> round(2) 
   crim      zn   indus    chas     nox      rm     age     dis     rad     tax 
  -0.90    1.04    0.07    0.69   -1.98    2.70    0.00   -3.03    2.46   -1.89 
ptratio   black   lstat 
  -2.04    0.85   -3.71 

What do you notice about the change in slopes?

(lm.ridge(medv ~ ., data = Boston)$coef - 
  lm.ridge(medv ~ ., lambda = 3, data = Boston)$coef) |> round(2) 
   crim      zn   indus    chas     nox      rm     age     dis     rad     tax 
  -0.02    0.04    0.07   -0.01   -0.08   -0.02    0.02   -0.08    0.20   -0.19 
ptratio   black   lstat 
  -0.02    0.00   -0.04 

If we increase \(\lambda\), is it more flexible or less flexible?

Show code
lm.ridge(medv ~ ., lambda = 10, data = Boston)$coef |> round(2)  
   crim      zn   indus    chas     nox      rm     age     dis     rad     tax 
  -0.86    0.95   -0.04    0.71   -1.81    2.74   -0.03   -2.86    2.10   -1.57 
ptratio   black   lstat 
  -1.99    0.84   -3.62 
Show code
(sum(lm.ridge(medv ~ ., data = Boston)$coef^2) -   
 sum(lm.ridge(medv ~ ., lambda = 10, data = Boston)$coef^2)) |> round(2)
[1] 8.15
Show code
lm.ridge(medv ~ ., lambda = 100, data = Boston)$coef |> round(2) 
   crim      zn   indus    chas     nox      rm     age     dis     rad     tax 
  -0.65    0.58   -0.40    0.74   -0.93    2.78   -0.17   -1.69    0.70   -0.61 
ptratio   black   lstat 
  -1.66    0.78   -2.96 
Show code
(sum(lm.ridge(medv ~ ., data = Boston)$coef^2) -   
 sum(lm.ridge(medv ~ ., lambda = 100, data = Boston)$coef^2)) |> round(2)
[1] 28

The larger \(\lambda\), the more the size of the slopes are penalized (8.15 for \(\lambda=10\) and 28 for \(\lambda = 100\)) so it suggests less flexibility as the constraints are greater.

We can put in a vector of \(\lambda\) in lm.ridge.

rr <-  lm.ridge(medv ~ ., lambda = seq(0, 100, 1), data = Boston)
head(rr$coef, n = 6)
               0          1           2           3           4           5
crim  -0.9281461 -0.9198713 -0.91195978 -0.90438489 -0.89712282 -0.89015213
zn     1.0815686  1.0664610  1.05200272  1.03814697  1.02485192  1.01207982
indus  0.1409000  0.1173849  0.09532805  0.07460249  0.05509527  0.03670572
chas   0.6817397  0.6851269  0.68829964  0.69127608  0.69407240  0.69670303
nox   -2.0567183 -2.0290101 -2.00213337 -1.97604581 -1.95070867 -1.92608614
rm     2.6742302  2.6827538  2.69083089  2.69849054  2.70575889  2.71265969
                6            7           8           9          10          11
crim  -0.88345345 -0.877009229 -0.87080351 -0.86482178 -0.85905074 -0.85347823
zn     0.99979661  0.987971372  0.97657603  0.96558497  0.95497477  0.94472399
indus  0.01934381  0.002928797 -0.01261197 -0.02734401 -0.04132656 -0.05461329
chas   0.69918088  0.701517544  0.70372344  0.70580798  0.70777968  0.70964626
nox   -1.90214508 -1.878854714 -1.85618641 -1.83411346 -1.81261091 -1.79165536
rm     2.71921451  2.725443049  2.73136333  2.73699188  2.74234394  2.74743355
               12          13          14         15         16         17
crim  -0.84809308 -0.84288502 -0.83784457 -0.8329630 -0.8282321 -0.8236444
zn     0.93481290  0.92522334  0.91593856  0.9069431  0.8982225  0.8897635
indus -0.06725299 -0.07929004 -0.09076495 -0.1017147 -0.1121733 -0.1221718
chas   0.71141474  0.71309152  0.71468243  0.7161928  0.7176276  0.7189913
nox   -1.77122487 -1.75129882 -1.73185776 -1.7128834 -1.6943584 -1.6762664
rm     2.75227370  2.75687642  2.76125291  2.7654136  2.7693681  2.7731257
              18         19         20         21         22         23
crim  -0.8191929 -0.8148711 -0.8106730 -0.8065928 -0.8026252 -0.7987653
zn     0.8815536  0.8735814  0.8658359  0.8583073  0.8509858  0.8438629
indus -0.1317387 -0.1409004 -0.1496811 -0.1581033 -0.1661876 -0.1739533
chas   0.7202879  0.7215214  0.7226953  0.7238128  0.7248769  0.7258904
nox   -1.6585919 -1.6413203 -1.6244375 -1.6079303 -1.5917861 -1.5759929
rm     2.7766947  2.7800831  2.7832985  2.7863478  2.7892377  2.7919745
              24         25         26         27         28         29
crim  -0.7950084 -0.7913501 -0.7877864 -0.7843133 -0.7809271 -0.7776245
zn     0.8369300  0.8301794  0.8236038  0.8171962  0.8109500  0.8048591
indus -0.1814181 -0.1885986 -0.1955101 -0.2021669 -0.2085824 -0.2147689
chas   0.7268560  0.7277760  0.7286527  0.7294883  0.7302845  0.7310434
nox   -1.5605392 -1.5454142 -1.5306074 -1.5161089 -1.5019091 -1.4879990
rm     2.7945641  2.7970119  2.7993235  2.8015036  2.8035572  2.8054888
              30         31         32         33         34         35
crim  -0.7744022 -0.7712571 -0.7681863 -0.7651869 -0.7622565 -0.7593925
zn     0.7989176  0.7931201  0.7874611  0.7819358  0.7765395  0.7712676
indus -0.2207382 -0.2265010 -0.2320676 -0.2374474 -0.2426494 -0.2476820
chas   0.7317665  0.7324556  0.7331121  0.7337375  0.7343330  0.7348999
nox   -1.4743698 -1.4610131 -1.4479210 -1.4350857 -1.4224999 -1.4101565
rm     2.8073025  2.8090026  2.8105929  2.8120771  2.8134589  2.8147415
              36         37         38         39         40         41
crim  -0.7565925 -0.7538543 -0.7511758 -0.7485549 -0.7459897 -0.7434783
zn     0.7661159  0.7610802  0.7561568  0.7513420  0.7466322  0.7420240
indus -0.2525531 -0.2572700 -0.2618397 -0.2662689 -0.2705637 -0.2747299
chas   0.7354394  0.7359526  0.7364406  0.7369044  0.7373448  0.7377628
nox   -1.3980488 -1.3861700 -1.3745140 -1.3630746 -1.3518462 -1.3408229
rm     2.8159282  2.8170221  2.8180262  2.8189433  2.8197762  2.8205274
              42         43         44         45         46         47
crim  -0.7410190 -0.7386101 -0.7362499 -0.7339370 -0.7316698 -0.7294470
zn     0.7375142  0.7330998  0.7287778  0.7245453  0.7203998  0.7163386
indus -0.2787731 -0.2826985 -0.2865110 -0.2902153 -0.2938157 -0.2973166
chas   0.7381592  0.7385349  0.7388905  0.7392268  0.7395444  0.7398441
nox   -1.3299994 -1.3193705 -1.3089311 -1.2986764 -1.2886017 -1.2787024
rm     2.8211995  2.8217948  2.8223157  2.8227644  2.8231430  2.8234537
              48         49         50         51         52         53
crim  -0.7272671 -0.7251290 -0.7230313 -0.7209728 -0.7189525 -0.7169691
zn     0.7123592  0.7084593  0.7046365  0.7008886  0.6972136  0.6936094
indus -0.3007218 -0.3040352 -0.3072603 -0.3104005 -0.3134590 -0.3164389
chas   0.7401264  0.7403919  0.7406412  0.7408747  0.7410931  0.7412968
nox   -1.2689742 -1.2594128 -1.2500141 -1.2407742 -1.2316893 -1.2227556
rm     2.8236983  2.8238788  2.8239970  2.8240547  2.8240537  2.8239955
              54         55         56         57         58         59
crim  -0.7150218 -0.7131093 -0.7112308 -0.7093854 -0.7075720 -0.7057899
zn     0.6900741  0.6866058  0.6832026  0.6798629  0.6765849  0.6733670
indus -0.3193431 -0.3221744 -0.3249355 -0.3276289 -0.3302570 -0.3328220
chas   0.7414862  0.7416619  0.7418241  0.7419734  0.7421101  0.7422346
nox   -1.2139695 -1.2053277 -1.1968266 -1.1884631 -1.1802340 -1.1721362
rm     2.8238818  2.8237140  2.8234938  2.8232224  2.8229014  2.8225321
              60         61         62         63         64         65
crim  -0.7040382 -0.7023160 -0.7006227 -0.6989575 -0.6973195 -0.6957082
zn     0.6702077  0.6671054  0.6640587  0.6610662  0.6581265  0.6552383
indus -0.3353263 -0.3377718 -0.3401606 -0.3424947 -0.3447757 -0.3470056
chas   0.7423473  0.7424484  0.7425383  0.7426174  0.7426858  0.7427441
nox   -1.1641668 -1.1563229 -1.1486017 -1.1410005 -1.1335166 -1.1261475
rm     2.8221157  2.8216535  2.8211468  2.8205967  2.8200044  2.8193710
              66         67         68         69         70         71
crim  -0.6941229 -0.6925628 -0.6910274 -0.6895161 -0.6880282 -0.6865632
zn     0.6524004  0.6496114  0.6468703  0.6441758  0.6415269  0.6389225
indus -0.3491858 -0.3513182 -0.3534042 -0.3554452 -0.3574427 -0.3593981
chas   0.7427922  0.7428307  0.7428597  0.7428795  0.7428902  0.7428923
nox   -1.1188907 -1.1117438 -1.1047045 -1.0977704 -1.0909394 -1.0842093
rm     2.8186975  2.8179850  2.8172345  2.8164470  2.8156234  2.8147647
              72         73         74         75         76         77
crim  -0.6851205 -0.6836996 -0.6823001 -0.6809212 -0.6795627 -0.6782240
zn     0.6363615  0.6338429  0.6313658  0.6289291  0.6265320  0.6241736
indus -0.3613126 -0.3631876 -0.3650241 -0.3668233 -0.3685864 -0.3703145
chas   0.7428857  0.7428709  0.7428480  0.7428171  0.7427785  0.7427324
nox   -1.0775781 -1.0710436 -1.0646039 -1.0582571 -1.0520014 -1.0458347
rm     2.8138718  2.8129455  2.8119867  2.8109962  2.8099748  2.8089233
              78         79         80         81         82         83
crim  -0.6769047 -0.6756042 -0.6743223 -0.6730585 -0.6718123 -0.6705833
zn     0.6218530  0.6195693  0.6173218  0.6151096  0.6129320  0.6107882
indus -0.3720084 -0.3736693 -0.3752981 -0.3768957 -0.3784629 -0.3800006
chas   0.7426789  0.7426183  0.7425506  0.7424761  0.7423950  0.7423072
nox   -1.0397555 -1.0337620 -1.0278524 -1.0220252 -1.0162788 -1.0106115
rm     2.8078424  2.8067329  2.8055954  2.8044308  2.8032396  2.8020225
              84         85         86         87         88         89
crim  -0.6693713 -0.6681758 -0.6669965 -0.6658330 -0.6646849 -0.6635521
zn     0.6086775  0.6065992  0.6045526  0.6025370  0.6005518  0.5985964
indus -0.3815096 -0.3829908 -0.3844448 -0.3858724 -0.3872743 -0.3886512
chas   0.7422131  0.7421128  0.7420063  0.7418939  0.7417757  0.7416517
nox   -1.0050218 -0.9995084 -0.9940697 -0.9887043 -0.9834109 -0.9781880
rm     2.8007802  2.7995132  2.7982223  2.7969079  2.7955707  2.7942111
              90         91         92         93         94         95
crim  -0.6624340 -0.6613304 -0.6602411 -0.6591657 -0.6581039 -0.6570555
zn     0.5966701  0.5947723  0.5929024  0.5910600  0.5892444  0.5874550
indus -0.3900038 -0.3913326 -0.3926382 -0.3939214 -0.3951826 -0.3964224
chas   0.7415221  0.7413871  0.7412467  0.7411011  0.7409504  0.7407946
nox   -0.9730345 -0.9679490 -0.9629303 -0.9579772 -0.9530884 -0.9482629
rm     2.7928299  2.7914274  2.7900043  2.7885610  2.7870980  2.7856158
              96         97         98         99        100
crim  -0.6560202 -0.6549976 -0.6539877 -0.6529900 -0.6520044
zn     0.5856915  0.5839532  0.5822396  0.5805503  0.5788848
indus -0.3976413 -0.3988399 -0.4000186 -0.4011779 -0.4023184
chas   0.7406339  0.7404684  0.7402982  0.7401233  0.7399440
nox   -0.9434994 -0.9387970 -0.9341544 -0.9295707 -0.9250448
rm     2.7841149  2.7825956  2.7810586  2.7795042  2.7779328
broom::tidy(rr)
# A tibble: 1,313 × 5
   lambda    GCV term  estimate   scale
    <dbl>  <dbl> <chr>    <dbl>   <dbl>
 1      0 0.0456 crim   -0.928    8.59 
 2      0 0.0456 zn      1.08    23.3  
 3      0 0.0456 indus   0.141    6.85 
 4      0 0.0456 chas    0.682    0.254
 5      0 0.0456 nox    -2.06     0.116
 6      0 0.0456 rm      2.67     0.702
 7      0 0.0456 age     0.0195  28.1  
 8      0 0.0456 dis    -3.10     2.10 
 9      0 0.0456 rad     2.66     8.70 
10      0 0.0456 tax    -2.08   168.   
# ℹ 1,303 more rows

We can plot this output.

plot(rr)

Show code
ggplot(broom::tidy(rr),
       aes(x = lambda, y = estimate, group = term, color = term)) + 
  geom_line()

We can see how the slope estimates shrink as \(\lambda\) increases.

What is the best \(\lambda\)? There are multiple approaches in the literature and MASS provides three of them.

Use MASS::select().

select(rr)
modified HKB estimator is 4.594163 
modified L-W estimator is 3.961575 
smallest value of GCV  at 4 

MASS::select() provides a value for the best estimate based on minimizing the MSE using leave-one-out cross-validation.

plot(rr$lambda, rr$GCV, lwd = .5)

Show code
ggplot(broom::tidy(rr), 
       aes(x = lambda, y = GCV)) +
  geom_line() +
  geom_vline(xintercept = broom::tidy(rr)$lambda[which.min(broom::tidy(rr)$GCV)],
             color = "red", lty = 2)

We can now focus in on the range for \(\lambda\).

rr <-  lm.ridge(medv ~ ., lambda = seq(0, 8, .01), data = Boston)
select(rr)
modified HKB estimator is 4.594163 
modified L-W estimator is 3.961575 
smallest value of GCV  at 4.26 
Show code
ggplot(broom::tidy(rr), 
       aes(x = lambda, y = GCV)) +
  geom_line() +
  geom_vline(xintercept = broom::tidy(rr)$lambda[which.min(broom::tidy(rr)$GCV)],
             color = "red", lty = 2)

We could get even more precise.

rr <-  lm.ridge(medv ~ ., lambda = seq(4, 5, .0001), data = Boston)
select(rr)
modified HKB estimator is 4.594163 
modified L-W estimator is 3.961575 
smallest value of GCV  at 4.2596 
Show code
ggplot(broom::tidy(rr), 
       aes(x = lambda, y = GCV)) +
  geom_line() +
  geom_vline(xintercept = broom::tidy(rr)$lambda[which.min(broom::tidy(rr)$GCV)],
             color = "red", lty = 2)

6.5.6 Observations about Ridge Regression

R finds the best \(\lambda\), the one that minimizes the Generalized Prediction MSE (GCV).

It is “generalized” as it divides the LOOCV estimate of the variance of the residuals by the square of the “trace” of \((I-H)\).

\[ \text{MSE}_\text{GCV} = \frac{1}{n}\sum\frac{(y_i - \hat{y}_{i(-i)})^2}{\text{trace}^2(I-H)} \]

  • \(H\) is the Hat Matrix used to multiply the \(Y\) to get the predicted values of \(Y\); it connects \(Y\) to \(\hat{Y}\) (it puts the “hat” on \(y\)).
    • Note: The residual error \(\epsilon = Y - \hat{Y} = Y - HY = (I-H)Y\).
    • \(H = X(X'X)^{-1}X'\).
    • The elements of hat matrix have their values between 0 and 1 and their sum is \(p\).
    • The diagonal elements of the hat matrix are an indicator of whether or not an observation is extreme with respect to the \(X\) values.
    • A large value of \(h_{ii}\) indicates the \(i\)th case is distant from the center of the \(n\) cases.
  • The Trace of a square matrix is the sum of its diagonal values.
    • \(\text{trace}^2(H) = \sum(1 - h_{ii})^2\).
    • This provides a measure of the variance of the residuals as \(\text{Var}(y_i - \hat{y}_i) = \sigma^2(1-h_{ii})\).

So, dividing by the trace normalizes the MSE.

The Ridge Regression estimates are also linear functions of the responses.

\[ \begin{align} \vec{b} &= (\bf{X'}\bf{X}+ \lambda I)^{-1}\bf{X'}Y \\\\ &\text{ factor out the }X'X \rightarrow \\\\ &= \bigg(\bf{X'}\bf{X}[I + \lambda(\bf{X'}\bf{X})^{-1}]\bigg)^{-1}\bf{X'}Y\\\\ \text{ use the rule for inverse }& \text{of matrix products }(AB)^{-1} = B^{-1}A^{-1} \rightarrow \\\\ &= \underbrace{(I + \lambda(\bf{X'}\bf{X})^{-1})^{-1}}_{\text{Some matrix}}\underbrace{(\bf{X'}\bf{X})^{-1}\bf{X'}Y}_{b_{\lambda = 0} \text{ the standard LSE, a linear function of } \vec{Y}} \end{align} \]

Important

Conclusion:

  • Ridge regression slope estimates are linear and have lower variance due to shrinkage.

  • But since they are not the BLUE, they must have some bias.

Ridge Regression is an option when the reduction in the variance is greater than the increase in bias.

6.6 Lasso Regression

6.6.1 Ridge Regression Does Not Shrink Parameters to 0

The presence of high correlations in the Boston data from {MASS} is an example where we would expect to see higher variance inflation factors.

Show code
library(MASS)
reg <- lm(medv ~ ., data = Boston)
round(car::vif(reg), 1)
   crim      zn   indus    chas     nox      rm     age     dis     rad     tax 
    1.8     2.3     4.0     1.1     4.4     1.9     3.1     4.0     7.5     9.0 
ptratio   black   lstat 
    1.8     1.3     2.9 

Here we see VIF of 7.5 and 9.

If you believe all of the variables are important, perhaps you are unsure which to remove.

Under Ridge Regression, we got small parameters with \(\lambda = 4.26\).

Show code
lm.ridge(medv ~ ., lambda = 4.26, data = Boston)
                       crim            zn         indus          chas 
 3.495372e+01 -1.041870e-01  4.384158e-02  7.326148e-03  2.738093e+00 
          nox            rm           age           dis           rad 
-1.679498e+01  3.857388e+00 -1.932605e-04 -1.422995e+00  2.743521e-01 
          tax       ptratio         black         lstat 
-1.081962e-02 -9.372977e-01  9.291544e-03 -5.172556e-01 

But none of the parameters went to 0. It did not “de-select” any parameters.

  • This is due to the structure of the constraint being a circle.
  • Ridge regression can only shrink the parameters asymptotically to 0.
  • The ridge penalty shrinks the coefficients of correlated predictors towards each other.

6.6.2 LASSO Regression is a Variant of Ridge Regression

Ridge regression is a shrinkage procedure that minimizes the \(\text{SSErr} = \sum(y_i-\hat{y}_i)^2\) subject to the constraint \(||\vec{b^2}||_2^2 = \sum_{j=1}^{p}b_j^2 \leq \gamma\) which uses the \(L_2\) norm, in effect creating a circle for the constraint.

Lasso regression is the same approach with one exception!

  • Lasso Regression uses a different constraint structure to enable it to shrink parameters to 0.

LASSO (Least Absolute Selection and Shrinkage Operator) uses the \(L_1\) norm instead of the \(L_2\) norm.

6.6.3 The \(L_1\) Norm

  • Mathematicians have defined many different types of “spaces” for operations.
  • \(L_1\) is one we use in everyday life, often without thinking about it.

\[ L_1 \equiv ||\vec{b}||_{L_1} = \sum |b_j| \tag{6.16}\]

As an example, when walking through a city with a grid block system, you can’t walk the shortest distance between two points measured in \(L_2\) as it would require you to go through buildings (unless you are She-Hulk or SpiderPig).

  • You would use the \(L_1\) norm as it counts up the total of the number of blocks in each direction: East/West and North/South.

As another example, when you are parking in a lot with the pedestrian exit to a building in one corner, the cars normally fill up as a triangle. Your distance to the exit is the sum of the sides, not the hypotenuse.

Lasso Regression uses the \(L_1\) norm as a constraint on minimizing the SSE.

  • This means finding the Least SSE by selecting parameters and shrinking them based on their Absolute Values.
  • Thus the name Least Absolute Selection and Shrinkage.

6.6.4 Shape of the Constraint Function for LASSO

What does the shape look like for the constraint based on an \(L_1\) norm? \(L_1 = ||\vec{b}||_{L_1} = \sum |b_j|\)?

  • Consider the example where \(p\) = 2 so we have \(b_1\) and \(b_2\).

Given some value \(\gamma\) (gamma), what does the shape look like for the constraint based on the \(L_1\) norm? \(L_1 = ||\vec{b}||_{L_1} = \sum |b_j| \leq \gamma\)?

  • Absolute value means you can operate in just the first quadrant of a Cartesian plane and then flip the shape over for negative \(b_1\) and then flip again for negative \(b_2\).

  • What does it look like for equality, when \(b_1 + b_2 = \gamma\)?

The L1 constrained region.

This is a “circle” in \(L_1\) space!

6.6.4.1 Visualizing the Solution to the LASSO Constrained Optimization Function

Our MSE parabaloid is still the same shape as in Figure 6.2.

Minimizing the SSE parabaloid.

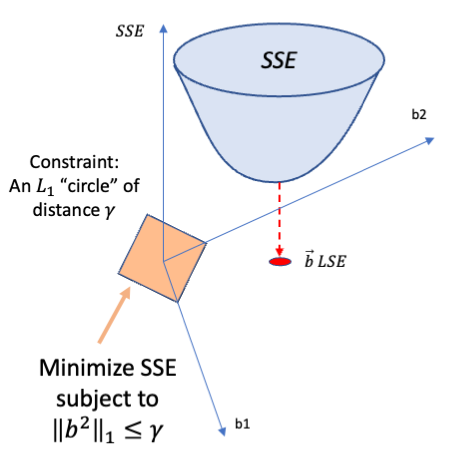
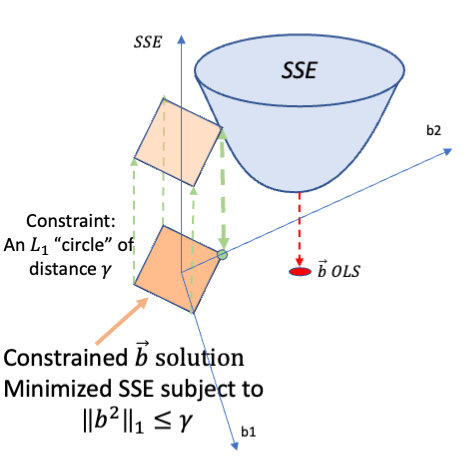
Now, instead of an \(L_2\) circle, we have an \(L_1\) “circle” as a constraint.

Figure 6.5: Minimizing the SSE parabaloid in L1 by using a plane/extending the “circle” to find the new minimum SSE.

Now the extended column from the “circle” can touch the parabaloid in several different ways!

Figure 6.6: Minimizing the SSE parabaloid in L1 by using extending the “circle” to find the new minimum SSE.

If a vertex of the constraint shape first touches the SSE parabaloid as seen in Figure 6.6, then the solution is on the \(b_2\) axis, which means \(b2 = \gamma\), which means \(b_1 = 0\)!

  • Thus the variable \(x_1\) is eliminated from the model!

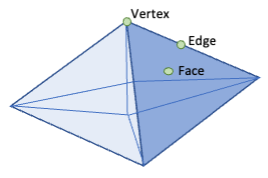
In three dimensions, think of the shape as a double pyramid.

Constraint shape becomes a double pyramid when p=3 in L1.
  • If a vertex (the extreme value for an axis) touches the parabaloid first, that \(|b_j| = \gamma\) so the other two variable’s parameters are 0 so two variables are eliminated from the model.

  • If an edge of the constraint shape touches first, that means solution is on a line connecting two of the \(b_j\) so \(|b_j| + |b_k| = \gamma\) and \(b_i = 0\) so one variable is eliminated from the model.

  • If a face of the double pyramid hits the parabaloid first, then the intersecting point has non-zero values on all three axes, so \(|b_i| + |b_j| + |b_k| = \gamma\) and no variables are eliminated from the model.

Constraint shape becomes a double pyramid when p=3 in L1

At higher dimensions, the constraint and the parabaloid shapes get more complicated with many different kinds of faces and edges and vertices that could intersect first.

Depending upon where the constraint shape intersects the parabaloid, lasso regression may eliminate 0, 1, 2, … \(p\) variables if the \(\gamma\) is small enough or \(\lambda\) is large enough.

Important

LASSO does two things

  1. Shrinks that parameter estimates by penalizing larger slopes –> variance reduction

  2. De-selects variables by setting the slopes to 0 –> dimension reduction.

6.7 Examples of Ridge and LASSO in R with {glmnet}

The {glmnet} package (developed by the textbook authors and others) handles elastic-net regression which includes both Ridge Regression and LASSO as special cases.

The primary functions of interest to us are

  • glmnet::glmnet() for creating models
  • glmnet::cv.glm() for conducting cross-validation
  • glmnet::plot() for seeing a variety of results
  • glmnet::coef() for getting the coefficients
  • glmnet::predict() for making predictions

glmnet::glmnet() uses an “elastic net mixing parameter”, \(\alpha\), (a tuning parameter) where \(0\leq\alpha\leq1\) to differentiate methods.

  • For pure ridge regression set \(\alpha = 0\).
  • For pure LASSO set \(\alpha = 1\).
  • For combination models of the two set \(0<\alpha <1\).
  • It also has other parameters to allow for a wide variety of models, both Gaussian and non-Gaussian.

Let’s load the {glmnet} package.

library(glmnet)

The glmnet() function requires inputs of x, a design matrix for the \(\bf{X}\) values (without intercept column) and y, a vector for the response values \(\vec{Y}\).

  • The input matrix x must have dimensions of number of observation \(\times\) number of variables, which means no intercept.
  • glmnet() computes the intercept for the fitted models unless intercept = FALSE.

To create the design matrix x:

  • Use stats::model.matrix(lm(y ~ ., data = my_data)) to build a linear model object and create the model matrix from it.

  • Generate \(\bf{X}\) by dropping the intercept term from the first column of the matrix

  • Save the matrix as x.

  • Create \(\vec{Y}\) as y by assignment from the original data frame.

reg <- lm(medv ~ ., data = Boston) 
x <- model.matrix(reg)
dim(x)
[1] 506  14
head(x, 3)
  (Intercept)    crim zn indus chas   nox    rm  age    dis rad tax ptratio
1           1 0.00632 18  2.31    0 0.538 6.575 65.2 4.0900   1 296    15.3
2           1 0.02731  0  7.07    0 0.469 6.421 78.9 4.9671   2 242    17.8
3           1 0.02729  0  7.07    0 0.469 7.185 61.1 4.9671   2 242    17.8
   black lstat
1 396.90  4.98
2 396.90  9.14
3 392.83  4.03
x <- x[, -1]
dim(x)
[1] 506  13
head(x, 3)
     crim zn indus chas   nox    rm  age    dis rad tax ptratio  black lstat
1 0.00632 18  2.31    0 0.538 6.575 65.2 4.0900   1 296    15.3 396.90  4.98
2 0.02731  0  7.07    0 0.469 6.421 78.9 4.9671   2 242    17.8 396.90  9.14
3 0.02729  0  7.07    0 0.469 7.185 61.1 4.9671   2 242    17.8 392.83  4.03
y <- Boston$medv

6.7.1 Ridge Regression using glmnet::glmnet()

  • To run ridge regression, set the mixing parameter argument alpha = 0.
rr <- glmnet(x, y, alpha = 0)

{glmnet} has its own versions of the plot() function to support the output objects it creates.

Use plot() to visualize the output of glmnet::glmnet()

  • The axis above the plot indicates the number of nonzero coefficients at the current \(\lambda\), which is the effective degrees of freedom (df) for the regression.
  • Setting label=TRUE identifies the coefficients.
  • By default it shows you the coefficients (the slopes) vs the \(L_1\) norm.
plot(rr, label = TRUE)

As gamma decreases (L1 norm), more parameters get closer to zero but the number of non-zero parameters in the model stays the same (top).
plot(rr, label = TRUE, ylim = c(-3, 3))

As gamma decreases (L1 norm), more parameters get closer to zero but the number of non-zero parameters in the model stays the same (top).
plot(rr, label = TRUE, ylim = c(-.3, .3))

As gamma decreases (L1 norm), more parameters get closer to zero but the number of non-zero parameters in the model stays the same (top).
  • The slopes are getting closer to 0 as the \(\gamma\) in \(||\hat{b^2}||_2\leq \gamma\) becomes smaller, closer to 0, more constrained.
  • What happens at \(\gamma = 0\)?
  • Note: Since we are forcing ridge regression with alpha = 0, the plot should really say L2 Norm not L1.

We can also plot against \(\lambda\).

  • It runs through a sequence of up to 100 lambda by default (using a log scale to speed convergence).
plot(rr, xvar = "lambda", label = TRUE)

As lambda increases, parameters get closer to zero but the number of non-zero parameters in the model stays the same (top).
plot(rr, xvar = "lambda", ylim = c(-.3, .3), label = TRUE)

As lambda increases, parameters get closer to zero but the number of non-zero parameters in the model stays the same (top).
  • Here we can also see the asymptotic approach towards 0 as \(\lambda\) gets larger, increasing the weight of the penalty for larger coefficients.

6.7.1.1 Finding \(\lambda\) with Cross Validation

We can use the built in cross-validation function cv.glmnet() to find the \(\lambda\) for the “best” model.

  • The default is nfolds = 10 for \(K=10\)-fold cross validation.
  • The default for \(\alpha\) is \(1\) so you have to set to 0. It is not an explicit argument but you can add it in as a ....
set.seed(123)
rr_cv <- cv.glmnet(x, y, alpha = 0)
rr_cv

Call:  cv.glmnet(x = x, y = y, alpha = 0) 

Measure: Mean-Squared Error 

    Lambda Index Measure    SE Nonzero
min  0.678   100   24.61 4.561      13
1se  5.759    77   29.17 5.767      13
  • lambda.min is the value of \(\lambda\) that gives minimum mean cross-validated error.

  • lambda.1se is the value of \(\lambda\) that gives the most regularized model with a cross-validated error within one standard error of lambda.min.

  • Why two outputs?

  • plot() shows the cross-validation curve (red dotted line) along with upper and lower standard deviation curves along the \(\lambda\) sequence (error bars).

  • The vertical dotted lines indicate lambda.min and lambda.1se.

plot(rr_cv)

As lambda increases, the MSE increases but the number of non-zero parameters in the model stays the same (top).
  • The number of non-zero parameters in the model at the top does not include the intercept (since glmnet() centers the data).
  • Note: no coefficients or variables were eliminated from the model as ridge regression just shrinks the parameters “close” to 0.

6.7.1.2 Ridge Regression Coefficients

To see the coefficients of the model for a \(\lambda\) of interest, use coef( s = lambda) where lambda is the value of \(\lambda\).

  • coef() returns a sparse matrix by default. You can pipe to as.matrix() to get a full matrix.
  • The . in the output represents 0 values.

The default for s = lambda is lambda.1se as the “best” model with a smaller chance of overfitting than lambda.min.

Show code
coef(rr_cv) |> round(2)
14 x 1 sparse Matrix of class "dgCMatrix"
               s1
(Intercept) 20.60
crim        -0.06
zn           0.02
indus       -0.07
chas         2.60
nox         -4.59
rm           3.33
age         -0.01
dis         -0.39
rad          0.01
tax          0.00
ptratio     -0.61
black        0.01
lstat       -0.31
Show code
coef(rr_cv, s = "lambda.min") |> round(2)
14 x 1 sparse Matrix of class "dgCMatrix"
                s1
(Intercept)  28.00
crim         -0.09
zn            0.03
indus        -0.04
chas          2.90
nox         -11.91
rm            4.01
age           0.00
dis          -1.12
rad           0.15
tax          -0.01
ptratio      -0.85
black         0.01
lstat        -0.47
Show code
coef(rr_cv) |> as.matrix()|> round(2)
               s1
(Intercept) 20.60
crim        -0.06
zn           0.02
indus       -0.07
chas         2.60
nox         -4.59
rm           3.33
age         -0.01
dis         -0.39
rad          0.01
tax          0.00
ptratio     -0.61
black        0.01
lstat       -0.31
  • With Ridge Regression, you can see shifts among parameters, even between models with close SSE.
  1. \(||\)lambda.1se\(||_2\) - \(||\)lambda.min\(||_2\)
  2. \(\text{SSE}_\text{lambda.1se} - \text{SSE}_\text{lambda.min}\)
sum(coef(rr_cv, s = "lambda.1se")[-1]^2) - sum(coef(rr_cv, s = "lambda.min")[-1]^2) 
[1] -129.0707
rr_cv$cvm[rr_cv$index[2]] - rr_cv$cvm[rr_cv$index[1]] # mean cross-validated error
[1] 4.552863
  • In this case, the lambda.1se has a smaller \(L_2\) norm than lambda.min.
  • It has larger SSE, but may be good enough to reduce chance of overfitting.

6.7.2 LASSO regression using glmnet::glmnet()

The glmnet() default value for alpha is 0. If you leave out alpha=, it runs LASSO regression.

  • By default, it will run up to 100 models with different values of \(\lambda\) so you have choices.

    lr <- glmnet(x, y)
    lr
    
    Call:  glmnet(x = x, y = y) 
    
       Df  %Dev Lambda
    1   0  0.00 6.7780
    2   1  9.24 6.1760
    3   2 17.38 5.6270
    4   2 25.27 5.1270
    5   2 31.82 4.6720
    6   2 37.26 4.2570
    7   2 41.78 3.8780
    8   2 45.52 3.5340
    9   2 48.64 3.2200
    10  3 51.56 2.9340
    11  3 54.33 2.6730
    12  3 56.62 2.4360
    13  3 58.53 2.2190
    14  3 60.12 2.0220
    15  3 61.43 1.8430
    16  3 62.52 1.6790
    17  3 63.43 1.5300
    18  3 64.18 1.3940
    19  3 64.81 1.2700
    20  4 65.43 1.1570
    21  4 66.00 1.0540
    22  5 66.54 0.9607
    23  5 67.06 0.8754
    24  5 67.49 0.7976
    25  5 67.85 0.7267
    26  6 68.15 0.6622
    27  6 68.41 0.6034
    28  7 68.75 0.5498
    29  7 69.13 0.5009
    30  8 69.56 0.4564
    31  8 70.03 0.4159
    32  8 70.42 0.3789
    33  8 70.75 0.3453
    34  9 71.06 0.3146
    35  9 71.37 0.2866
    36  9 71.63 0.2612
    37  9 71.84 0.2380
    38  9 72.02 0.2168
    39 11 72.19 0.1976
    40 11 72.42 0.1800
    41 12 72.62 0.1640
    42 12 72.86 0.1495
    43 12 73.07 0.1362
    44 12 73.24 0.1241
    45 12 73.38 0.1131
    46 12 73.49 0.1030
    47 11 73.59 0.0939
    48 11 73.67 0.0855
    49 11 73.73 0.0779
    50 11 73.79 0.0710
    51 11 73.83 0.0647
    52 11 73.87 0.0590
    53 11 73.90 0.0537
    54 11 73.93 0.0489
    55 11 73.95 0.0446
    56 11 73.97 0.0406
    57 11 73.98 0.0370
    58 11 74.00 0.0337
    59 11 74.01 0.0307
    60 11 74.01 0.0280
    61 11 74.02 0.0255
    62 11 74.03 0.0232
    63 11 74.03 0.0212
    64 11 74.04 0.0193
    65 11 74.04 0.0176
    66 11 74.04 0.0160
    67 12 74.05 0.0146
    68 12 74.05 0.0133
    69 12 74.05 0.0121
    70 12 74.05 0.0111
    71 12 74.06 0.0101
    72 12 74.06 0.0092
    73 12 74.06 0.0084
    74 12 74.06 0.0076
    75 12 74.06 0.0069
    76 12 74.06 0.0063
  • If the models are not getting any better, it will stop with fewer than 100 (here 76).

  • The output:

    • The iteration for \(\lambda\).
    • The degrees of freedom (number of non-zero parameters in the model) chosen for each \(\lambda\).
    • The % Null deviance explained by the model (higher is better).
    • The Lagrange penalty value of \(\lambda\).
Show code
plot(lr, label = TRUE)

As gamma decreases (L1 norm), so does the number of non-zero parameters in the model (top).
Show code
plot(lr, label = TRUE, ylim = c(-3, 3))

As gamma decreases (L1 norm), so does the number of non-zero parameters in the model (top).
Show code
plot(lr, label = TRUE, ylim = c(-.3, .3))

As gamma decreases (L1 norm), so does the number of non-zero parameters in the model (top).

See how parameters are being driven to the zero line as the value of \(\gamma\) decreases, tightening the constraint and becoming less-flexible.

Show code
plot(lr, xvar = "lambda", label = TRUE)

As lambda increases, more parameters get sent to zero and the number of non-zero parameters in the model drops (top).
Show code
plot(lr, xvar = "lambda", ylim=c(-.3, .3), label = TRUE)

As lambda increases, more parameters get sent to zero and the number of non-zero parameters in the model drops (top).

See how parameters are being driven to the zero line as the value of \(\lambda\) increases, increasing the penalty for flexibility.

  • The axis above the plot shows the number of nonzero coefficients at the current \(\lambda\), which is the effective degrees of freedom (df) for the regression.

6.7.2.1 Finding \(\lambda\) with Cross Validation

To find the best lambda, use the built-in cross validation function cv.glmnet().

  • Now we can use the default alpha = 1 and do not have to enter the parameter.
  • The default is \(K=10\)-fold CV.
  • The plot() has the same red dots for the point estimates and the error bars for the standard error from the cross-validation.
  • The vertical lines indicatelambda.min and lambda.1se.
set.seed(123)
lr_cv <- cv.glmnet(x, y)
plot(lr_cv)

As lambda increases, the MSE increases and the number of non-zero parameters in the model decreases (top).
  • The number of predictive parameters in the model at the top does not include the intercept (since glmnet() centers the data).
  • Note: multiple coefficients or variables were eliminated from the model as the LASSO can shrink the parameters to 0.
  • Note the plot axis is in \(log(\lambda)\) or -3.6683935

The Cross Validation output tells us which \(\lambda\) is the “best”, and it assumes the best is lambda.1se.

lr_cv

Call:  cv.glmnet(x = x, y = y) 

Measure: Mean-Squared Error 

    Lambda Index Measure    SE Nonzero
min 0.0255    61   24.28 4.245      11
1se 0.5009    29   28.38 5.002       7

6.7.2.2 LASSO Coefficients

To see the coefficients of the “best model”, we can use coef() to get a sparse matrix.

  • The . in the output represents 0 values.
coef(lr_cv)
14 x 1 sparse Matrix of class "dgCMatrix"
                      s1
(Intercept) 14.161113866
crim        -0.013309174
zn           .          
indus        .          
chas         1.562819145
nox          .          
rm           4.237264636
age          .          
dis         -0.080074543
rad          .          
tax          .          
ptratio     -0.738845222
black        0.005949482
lstat       -0.513735694
coef(lr_cv, s = "lambda.min") 
14 x 1 sparse Matrix of class "dgCMatrix"
                       s1
(Intercept)  34.594713536
crim         -0.099226869
zn            0.041830020
indus         .          
chas          2.688250324
nox         -16.401122005
rm            3.861229964
age           .          
dis          -1.404571750
rad           0.256788020
tax          -0.009997514
ptratio      -0.931437290
black         0.009049252
lstat        -0.522505968
coef(lr_cv) |> as.matrix()
                      s1
(Intercept) 14.161113866
crim        -0.013309174
zn           0.000000000
indus        0.000000000
chas         1.562819145
nox          0.000000000
rm           4.237264636
age          0.000000000
dis         -0.080074543
rad          0.000000000
tax          0.000000000
ptratio     -0.738845222
black        0.005949482
lstat       -0.513735694
  1. \(||\)lambda.1se\(||_1\) - \(||\)lambda.min\(||_1\)
  2. \(\text{SSE}_\text{lambda.1se} - \text{SSE}_\text{lambda.min}\)
Show code
round(sum(abs(coef(lr_cv)[-1])) - sum(abs(coef(lr_cv, s = "lambda.min")[-1])), 1)
[1] -19.1
Show code
round(rr_cv$cvm[lr_cv$index[2]] - rr_cv$cvm[lr_cv$index[1]], 1) # Generalized average SSE from CV
[1] 35.1
  • With LASSO, you can also see shifts among parameters, even between models with close SSE.
  • In this case, the lambda.1se has a smaller \(L_1\) norm than lambda.min as the model added back in a few parameters to get to a smaller MSE.
  • lambda.1se has an MSE within one standard deviation of lambda.min.
  • lambda.1se is the default recommendation for coefficients as an effort to “regularize” the model and reduce the change of overfitting.

6.7.3 Predicting with {glmnet}

You can also make predictions at specific \(\lambda\)’s with new input data.

  • Here we will create a validation set of testing and training data and the associated design matrix and response vector for the training data.
Show code
set.seed(1234)
Z <- sample(nrow(Boston), .5*nrow(Boston))
boston_train <- Boston[Z,]
boston_test <- Boston[-Z,]

reg <- lm(medv ~ ., data = boston_train) 
x <- model.matrix(reg)[,-1]
y <- boston_train$medv

Use cross-validation to identify the “best model”.

Show code
train_r <- glmnet(x, y)
set.seed(123) # for the sampling in cross validation
train_r_cv <- cv.glmnet(x, y)
train_r_cv

Call:  cv.glmnet(x = x, y = y) 

Measure: Mean-Squared Error 

    Lambda Index Measure    SE Nonzero
min 0.0113    70   23.84 4.991      13
1se 0.8977    23   28.63 5.531       6
Show code
plot(train_r_cv)

Show code
coef(train_r_cv)
14 x 1 sparse Matrix of class "dgCMatrix"
                      s1
(Intercept)  8.344651634
crim        -0.024323576
zn           .          
indus        .          
chas         .          
nox          .          
rm           4.980759896
age          .          
dis          .          
rad          .          
tax         -0.003234253
ptratio     -0.654912674
black        0.002448329
lstat       -0.346559728

Now predict.

  • No need to fit the best model.
  • When you call predict() with a cv.glmnet class output object, it will call predict.cv.glmnet() which uses the object to generate the predictions for the new data (newx) and the \(\lambda\) of your choice.
Show code
# create test design matrix and vector
reg_test <- lm(medv ~ ., data = boston_test) 
x_test <- model.matrix(reg_test)[,-1]
y_test <- boston_test$medv

pred_test <- bind_cols(predict(train_r_cv, newx = x_test, s = "lambda.1se"),
                      predict(train_r_cv, newx = x_test, s = "lambda.min"))
pred_test |> head()
# A tibble: 6 × 2
  lambda.1se lambda.min
       <dbl>      <dbl>
1       29.4       29.7
2       25.7       25.0
3       31.3       30.7
4       30.1       28.7
5       24.0       23.1
6       22.5       20.7
Show code
round(colMeans((pred_test - y_test)^2), digits = 2)
lambda.1se lambda.min 
     29.86      24.79 

Now with six variables in lambda.1se and 13 in lambda.min, which model would you recommend?

6.8 A Bayesian Perspective

Both Ridge Regression and LASSO can be considered as Bayesian procedures.

  • You have a prior distribution, you get data, and you use the data to update the prior distribution \(p(Y)\) to a posterior distribution \(p(Y|X)\).

Suppose the slopes have a multivariate Normal prior distribution and the data also have a Normal distribution.

  • \(y_1, \ldots, y_n \sim \text{Normal}\)

  • \(\text{E}[y_i] = \beta_0 + \beta_1 x_{i1} + \beta_2x_{i2} + \cdots + \beta_px_{ip}\)

  • \(\text{Var}(y) = \sigma^2I\) - so the variance covariance is diagonal with all covariances = 0.

  • Suppose the prior distribution of \(\beta_1, \beta_2, \ldots, \beta_p\sim\text{Normal}(0, \tau^2)\).

Then the posterior density of \(\beta_1, \beta_2, \ldots, \beta_p\) is proportional to the prior distribution times the distribution of the data (appropriately normalized (so it integrates to 1)).

\[ \text{Posterior} \underbrace{\propto}_\text{prop}\Pi(\vec{\beta})f(\vec{y}) \propto \underbrace{e^{\frac{-\sum(y_i - x_ib)^2}{2\sigma^2}}}_{\text{Normal dist of }y}\,\,\underbrace{e^{\frac{-\sum b_j^2}{2\tau^2}}}_{\text{Prior of }\beta} =\underbrace{e^{-\frac{1}{\sigma^2}\underbrace{\big(\sum(y_i - \hat{y}_i)^2 + \lambda\sum b_j^2\big)}_\text{minimizing this}}}_\text{maximizes this} \tag{6.17}\]

This maximum of the distribution is also called the mode (the most common value).

  • In a Normal distribution, the mode = mean = median.

  • Maximizing the posterior density, we get the posterior mode, median, and mean.

  • Maximizing the mean requires minimizing \(\sum(y_i - \hat{y}_i)^2 + \lambda\sum b_j^2\).

This is the Ridge Regression solution!

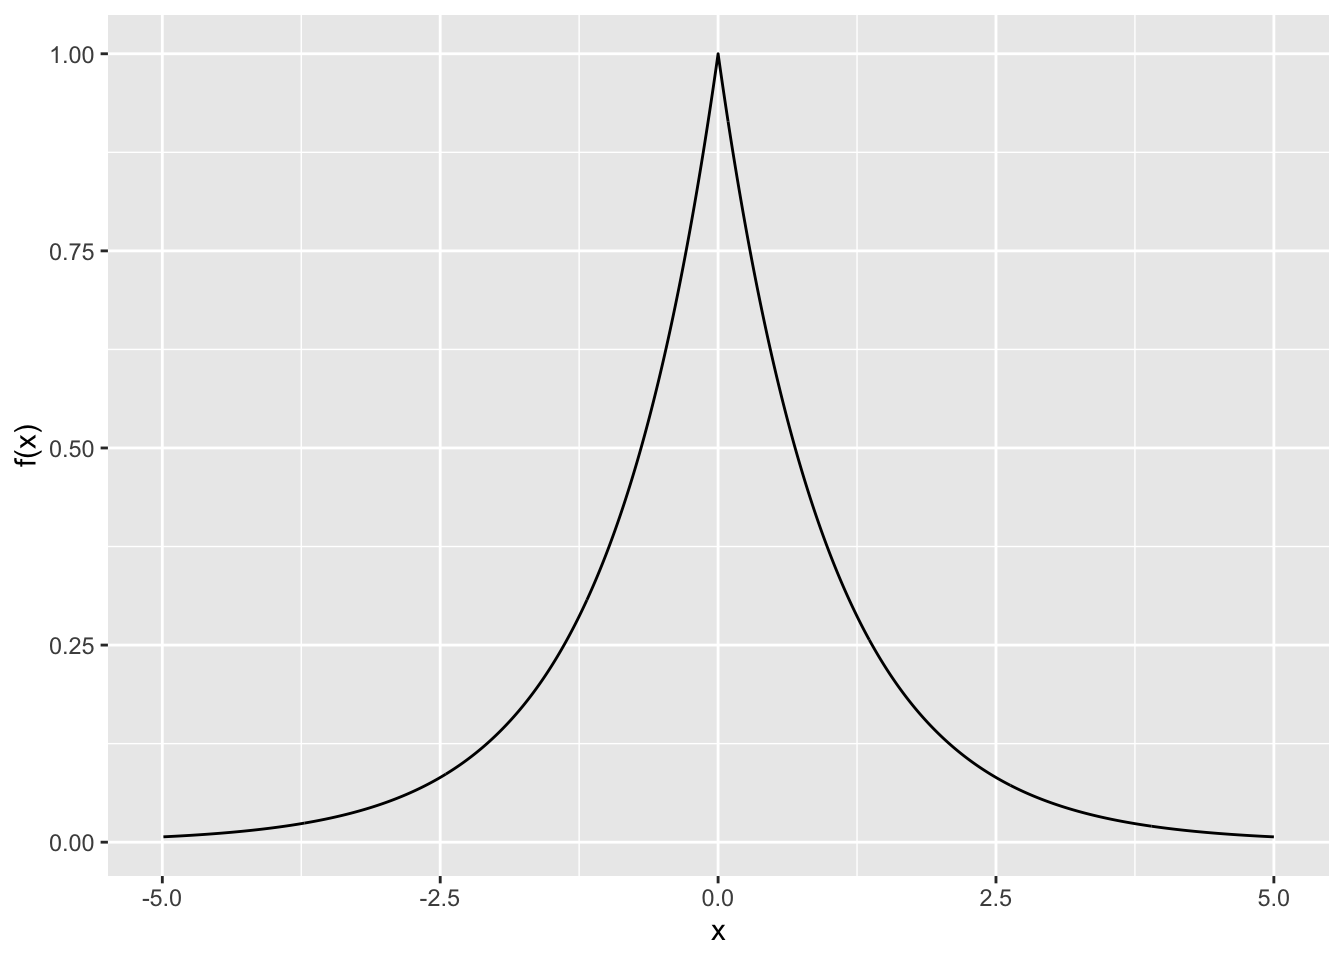
Now, if we change the prior distribution of the \(\beta_j\) to be double exponential (aka Laplace distribution), the prior density is \(\Pi(b_j) = \frac{1}{2\pi}e^{-||b_j||/\tau}\) and it looks like

So instead of squaring the exponent, as we do with a Normal distribution, the double exponential uses the absolute value.

\[ \text{Posterior density } \sim e^{-\frac{1}{\sigma^2}\big(\sum(y_i - \hat{y}_i)^2 + \lambda\sum |b_j|\big)} \tag{6.18}\]

  • Maximizing the mode = mean here, requires minimizing \(\sum(y_i - \hat{y}_i)^2 + \lambda\sum |b_j|\).

This is the Lasso Regression solution!

So both procedures can be seen as Bayesian Procedures!

What do the plots of the distributions suggest about the prior expectations of Ridge and Lasso?

Ridge

Lasso
Important

Variable selection regularizes models by adding or eliminating variables.

Ridge and Lasso regularize models by shrinking the coefficients.

We will now look at two methods for regularizing a model by using linear transformations of the \(\bf{X}\) to reduce the dimensions of the parameters to be estimated.

6.9 Principal Components Analysis (PCA)

6.9.1 Introduction to PCA

Goals:

  • Dimension Reduction
  • Complete elimination of multicollinearity (by construction)
  • Achieve
    • low variance
    • More reliable estimates
    • Better Predictive Power, higher probability of correctly rejecting the null hypothesis \(H_{0}\) when \(H_{A}\) is true.

Concept:

  • We have some high-dimensional data, with \(n\) observations of \(X_1, \ldots, X_p\).
  • We want to extract most of the information in the \(\bf{X}\) data in the form of just a few “features.”
    • The “features” are not the original variables; that would be just variable selection.
    • The “features” are the outputs of some function of the variables.
  • For PCA, the “features” can only be the outputs of functions from the range of possible linear combinations of \(X_1, \ldots, X_p\). For the \(k\)th feature,
    • \(Z_k = \sum a_{kj}X_{kj}\) where \(a_{kj}\) is a scalar associated with \(X_j\) for the \(k\)th feature.

How could we determine the “information” in \(\bf{X}\) so as to get “most” of it.

  • What if we set \(Z_k = 5 \quad \forall i = 1, \ldots, n\)?
    • Using a constant means \(\text{Var}(Z_k) = 0\).
    • That gives us no information about what is happening in \(\bf{X}\).
    • While we want low variance in our estimates, we want to know what is happening in the data.
    • We want to see where most of the differences are among variables, and that means we want a function with high variance.
  • A high variance can distinguish between the different values we are trying to predict; which have low values and which have high values.
  • We want: High Variance and zero Covariance to remove any multicollinearity so the variance is due to new information, not correlations.
    • We want to have our cake and eat it too!

The General Approach

  • Start with the predictor data; the variables of \(\bf{X}\).
  • Look for the linear combination of the \(\bf{X}\) with the highest variance.
    • Call it the First Principal Component, \(Z_1\).
    • We don’t care if it is interpretable.
    • A combination of \(3*Bedrooms + .5* Pool\) might be a good \(Z_1\) even if we can’t explain what it means.
  • To get the most information in the most efficient way we will construct a second Principal Component, a different linear combination \(Z_2\).
    • Construct \(Z_2\) so it has the highest variance and,
    • is orthogonal to \(Z_1\) so \(\text{Cov}(Z_1, Z_2)=0\).
  • Check if you have enough information (explained most of the variance of \(\bf{X}\)).
  • If yes, move to the regression phase. If no, find the next principal component \(Z_3\).

PCA is an approach to reduce the dimension of the regression by reducing the number of predictors in the model while retaining most of the information of the original predictors.

Note
  • PCA works best in situations where \(k<<p\).

6.9.2 Definitions of Principal Components

The First Principal Component (PC).

  • \(Z_1\) is the linear combination of the \(X_j\),

\[ Z_1 = \sum_{j=1}^p a_{1j}X_j \tag{6.19}\]

  • which maximizes the \(\text{Var}(Z_1)\) subject to \(||\vec{a_1}||_2 = \sum a_{1j}^2 \leq 1\).
    • The constraint is necessary to bound the values of the \(a_{1j}\) to avoid artificially increasing the variance of \(Z_k\) by merely increasing the \(a_{1j}\)s (which would be an “ill-posed” problem).
    • As a maximization, the solution will be on the edge of the space where \(\sum a_{1j}^2 = 1\).
  • Since it has the highest variance, \(Z_1\) has the most information one can extract out of \(\bf{X}\) with a single linear combination.

The Second Principal Component

  • \(Z_2\) is the linear combination of the \(X_j\),

\[ Z_2 = \sum_{j=1}^p a_{2j}X_j \]

  • which maximizes the \(\text{Var}(Z_2)\) subject to \(||\vec{a}_{2}||_2 = \sum a_{2j}^2 \leq 1\), and,
  • is uncorrelated with \(Z_1\), i.e., \(\text{Cov}(Z_1, Z_2)=0\).
    • This ensures no duplication of information.

The Third Principal Component

  • \(Z_3\) is the linear combination of the \(X_j\),

\[ Z_3 = \sum_{j=1}^p a_{3j}X_j \]

  • which maximizes the \(\text{Var}(Z_3)\) subject to \(||\vec{a}_{3}||_2 = \sum a_{3j}^2 \leq 1\), and,
  • is uncorrelated with \(Z_1\) and \(Z_2\) i.e., \(\text{Cov}(Z_1, Z_3)= \text{Cov}(Z_2, Z_3)=0\).

And so on, through all \(p\) principal components.

As you look at these definitions, is PCA a supervised or unsupervised approach?

  • PCA is unsupervised as we do not consider the \(\vec{Y}\) in choosing the \(Z_k\), just \(\bf{X}\).

We will use PCA in two methods:

  • Principal Components Regression (PCR) which is the regression \(\vec{Y} \sim \bf{Z}\vec{b}\) and
  • Partial Least Squares Regression (PLSR), a supervised variant where we consider the \(\vec{Y}\) in constructing the \(Z_j\).

6.9.3 Example of Principal Components in R

6.9.3.1 Example of Principal Components Analysis

We will use the restaurant data set.

Let’s review the variable definitions, get the data, and glimpse it.

library(tidyverse)
restdf <- read_csv("https://raw.githubusercontent.com/rressler/data_raw_courses/main/Restaurants.csv")

glimpse(restdf)
Rows: 279
Columns: 13
$ OUTLOOK  <dbl> 2, 4, 5, 5, 2, 3, 2, 3, 4, 4, 4, 4, 4, 3, 3, 4, 3, 2, 5, 3, 3…
$ SALES    <dbl> 480, 507, 210, 246, 148, 50, 72, 99, 160, 243, 200, 1000, 350…
$ NEWCAP   <dbl> 0, 22, 25, NA, NA, NA, 0, 7, 5, 7, 3, 20, NA, 0, 10, 8, 0, NA…
$ VALUE    <dbl> 600, 375, 275, 80, 85, 135, 125, 150, 85, 150, 225, 1500, NA,…
$ COSTGOOD <dbl> 35, 59, 40, 43, 45, 40, 85, 43, NA, 38, 42, 20, 31, 50, 50, N…
$ WAGES    <dbl> 25, 20, 24, 30, 35, 30, 10, 25, NA, 15, 22, 20, 35, 26, 40, N…
$ ADS      <dbl> 2, 5, 3, 1, 1, 10, 5, 1, NA, 2, 2, 10, NA, 2, 10, NA, 4, 5, 1…
$ TYPEFOOD <dbl> 2, 2, 1, 1, 3, 2, 2, 2, NA, 2, 1, 1, 1, 2, 2, NA, 1, 1, 2, 2,…
$ SEATS    <dbl> 200, 150, 46, 28, 44, 50, 50, 130, NA, 50, 64, 240, 111, 125,…
$ OWNER    <dbl> 3, 1, 1, 3, 1, 3, 1, 1, 2, 2, 1, 3, 3, 3, 1, 3, 3, 3, 3, 1, 2…
$ FTEMPL   <dbl> 8, 6, 0, 2, NA, 2, 0, 1, 2, 2, 3, 30, 10, 6, 4, 13, 7, 20, 1,…
$ PTEMPL   <dbl> 30, 25, 17, 13, NA, NA, 5, 8, 10, 19, 12, 40, 19, 16, 28, 47,…
$ SIZE     <dbl> 3, 2, 1, 1, NA, NA, 1, 1, 1, 2, 1, 3, 2, 2, 2, 3, 2, 3, 1, 2,…

Check the count of NAs and get the correlations with absolute value \(\geq .6\).

map_dbl(restdf, ~ sum(is.na(.)))
 OUTLOOK    SALES   NEWCAP    VALUE COSTGOOD    WAGES      ADS TYPEFOOD 
       1       25       55       39       42       44       44       12 
   SEATS    OWNER   FTEMPL   PTEMPL     SIZE 
      11       10       14       13       17 
cor(restdf, use = "complete.obs") |> round(1)
         OUTLOOK SALES NEWCAP VALUE COSTGOOD WAGES  ADS TYPEFOOD SEATS OWNER
OUTLOOK      1.0   0.1    0.2   0.1     -0.2   0.1 -0.1      0.0   0.1   0.2
SALES        0.1   1.0    0.7   0.9     -0.1   0.1  0.0     -0.1   0.7   0.2
NEWCAP       0.2   0.7    1.0   0.8     -0.1   0.3  0.0     -0.1   0.5   0.1
VALUE        0.1   0.9    0.8   1.0     -0.1   0.1  0.0     -0.1   0.7   0.2
COSTGOOD    -0.2  -0.1   -0.1  -0.1      1.0  -0.2  0.0     -0.1  -0.1  -0.3
WAGES        0.1   0.1    0.3   0.1     -0.2   1.0  0.1      0.0   0.2   0.2
ADS         -0.1   0.0    0.0   0.0      0.0   0.1  1.0      0.0   0.1   0.1
TYPEFOOD     0.0  -0.1   -0.1  -0.1     -0.1   0.0  0.0      1.0   0.0   0.1
SEATS        0.1   0.7    0.5   0.7     -0.1   0.2  0.1      0.0   1.0   0.3
OWNER        0.2   0.2    0.1   0.2     -0.3   0.2  0.1      0.1   0.3   1.0
FTEMPL       0.1   0.8    0.7   0.9     -0.2   0.1  0.0      0.0   0.7   0.3
PTEMPL       0.2   0.6    0.3   0.5     -0.2   0.2  0.0      0.0   0.6   0.3
SIZE         0.2   0.4    0.3   0.3     -0.3   0.3 -0.1      0.1   0.6   0.5
         FTEMPL PTEMPL SIZE
OUTLOOK     0.1    0.2  0.2
SALES       0.8    0.6  0.4
NEWCAP      0.7    0.3  0.3
VALUE       0.9    0.5  0.3
COSTGOOD   -0.2   -0.2 -0.3
WAGES       0.1    0.2  0.3
ADS         0.0    0.0 -0.1
TYPEFOOD    0.0    0.0  0.1
SEATS       0.7    0.6  0.6
OWNER       0.3    0.3  0.5
FTEMPL      1.0    0.4  0.5
PTEMPL      0.4    1.0  0.7
SIZE        0.5    0.7  1.0
(abs(cor(restdf, use = "complete.obs")) - .1) |> round(0)
         OUTLOOK SALES NEWCAP VALUE COSTGOOD WAGES ADS TYPEFOOD SEATS OWNER
OUTLOOK        1     0      0     0        0     0   0        0     0     0
SALES          0     1      1     1        0     0   0        0     1     0
NEWCAP         0     1      1     1        0     0   0        0     0     0
VALUE          0     1      1     1        0     0   0        0     1     0
COSTGOOD       0     0      0     0        1     0   0        0     0     0
WAGES          0     0      0     0        0     1   0        0     0     0
ADS            0     0      0     0        0     0   1        0     0     0
TYPEFOOD       0     0      0     0        0     0   0        1     0     0
SEATS          0     1      0     1        0     0   0        0     1     0
OWNER          0     0      0     0        0     0   0        0     0     1
FTEMPL         0     1      1     1        0     0   0        0     1     0
PTEMPL         0     0      0     0        0     0   0        0     0     0
SIZE           0     0      0     0        0     0   0        0     0     0
         FTEMPL PTEMPL SIZE
OUTLOOK       0      0    0
SALES         1      0    0
NEWCAP        1      0    0
VALUE         1      0    0
COSTGOOD      0      0    0
WAGES         0      0    0
ADS           0      0    0
TYPEFOOD      0      0    0
SEATS         1      0    0
OWNER         0      0    0
FTEMPL        1      0    0
PTEMPL        0      1    1
SIZE          0      1    1

We see a few high correlations.

We want to predict SALES with the other 12 variables as a predictor.

Let’s run a least squares regression and save the design matrix.

reg <-  lm(SALES ~ ., data = restdf)
X <-  model.matrix(reg)
X |> head()
   (Intercept) OUTLOOK NEWCAP VALUE COSTGOOD WAGES ADS TYPEFOOD SEATS OWNER
1            1       2      0   600       35    25   2        2   200     3
2            1       4     22   375       59    20   5        2   150     1
3            1       5     25   275       40    24   3        1    46     1
7            1       2      0   125       85    10   5        2    50     1
8            1       3      7   150       43    25   1        2   130     1
10           1       4      7   150       38    15   2        2    50     2
   FTEMPL PTEMPL SIZE
1       8     30    3
2       6     25    2
3       0     17    1
7       0      5    1
8       1      8    1
10      2     19    2

We can use stats::prcomp() to get the principal components of the design matrix X.

pc <- stats::prcomp(X)
pc
Standard deviations (1, .., p=13):
 [1] 1008.6875408   47.9058709   20.3969232   13.6475364   10.5683223
 [6]    9.2073956    8.1978879    3.7010005    1.3613053    0.8418605
[11]    0.8006215    0.4847915    0.0000000

Rotation (n x k) = (13 x 13):
                      PC1          PC2           PC3           PC4          PC5
(Intercept)  0.000000e+00  0.000000000  0.0000000000  0.0000000000  0.000000000
OUTLOOK     -1.435178e-04 -0.003062887 -0.0137015569  0.0132013837 -0.009957695
NEWCAP      -2.248547e-02 -0.020492738 -0.9605710061 -0.1346432786 -0.108822318
VALUE       -9.985260e-01  0.047024839  0.0222625044  0.0007621758 -0.006124556
COSTGOOD     1.594351e-03  0.028715632  0.0901525618 -0.8975951886 -0.228866391
WAGES       -6.457067e-04 -0.034539893 -0.2297738129  0.2197647052 -0.063496152
ADS         -9.081173e-05 -0.011741075 -0.0005603436 -0.0173497803 -0.018333394
TYPEFOOD     8.709692e-05 -0.002297582 -0.0017130747  0.0065237396  0.006973495
SEATS       -4.531399e-02 -0.990953401  0.0320099338 -0.0708913358  0.052233532
OWNER       -1.623006e-04 -0.006432299 -0.0020448846  0.0200983150  0.002628272
FTEMPL      -1.854717e-02 -0.046262692 -0.1119149698  0.0962467553  0.578733454
PTEMPL      -6.303463e-03 -0.104714611  0.0460065709  0.3351584716 -0.770337351
SIZE        -2.692355e-04 -0.007950072 -0.0047822641  0.0188399819 -0.011722355
                      PC6          PC7          PC8           PC9          PC10
(Intercept)  0.0000000000  0.000000000  0.000000000  0.0000000000  0.0000000000
OUTLOOK      0.0012915548  0.008252171  0.026621559  0.9960975505 -0.0729402971
NEWCAP       0.1466499303  0.157125762 -0.002882552 -0.0137437431  0.0022352821
VALUE        0.0079736413 -0.011642211  0.000966675  0.0003162924  0.0004888895
COSTGOOD    -0.3624765176 -0.033148577  0.007243455  0.0123824508  0.0156146469
WAGES       -0.4894270143 -0.807316560  0.047726196 -0.0013753791 -0.0062018886
ADS          0.0411467670 -0.086309273 -0.994108307  0.0250623779 -0.0283156993
TYPEFOOD     0.0008062145  0.007624424 -0.007103087 -0.0259660749  0.1029274799
SEATS        0.0750736146 -0.034488023  0.018097127 -0.0016742773 -0.0040553803
OWNER       -0.0117506043  0.004514620 -0.030815488  0.0767627114  0.9684594552
FTEMPL      -0.6763602873  0.420324076 -0.075960807  0.0010490049 -0.0216695791
PTEMPL      -0.3763526736  0.369476886 -0.038545850 -0.0144896892 -0.0183509539
SIZE        -0.0304650435  0.018608414  0.010820523  0.0060608822  0.2103802781
                     PC11         PC12 PC13
(Intercept)  0.0000000000  0.000000000    1
OUTLOOK     -0.0335726016  0.009655197    0
NEWCAP       0.0019703808 -0.002428689    0
VALUE       -0.0003161627  0.000490527    0
COSTGOOD    -0.0070139363  0.001256808    0
WAGES       -0.0061024153 -0.005298300    0
ADS          0.0028217914  0.019828225    0
TYPEFOOD    -0.9942171508  0.007436951    0
SEATS        0.0014059932 -0.002288363    0
OWNER        0.0970796045 -0.212614287    0
FTEMPL       0.0057889618 -0.019625557    0
PTEMPL      -0.0019884979 -0.030605994    0
SIZE         0.0290321395  0.976161134    0

The top output is the standard deviation of each of the \(p\) principal components. What do you notice?

100*(pc$sdev^2/sum(pc$sdev^2)) |> round(3)
 [1] 99.7  0.2  0.0  0.0  0.0  0.0  0.0  0.0  0.0  0.0  0.0  0.0  0.0

The bottom output is the linear combinations of the variables used to create each principle component.

  • These are the \(a_j, b_j, c_j, \ldots\) for each PC.

We left the intercept in the design matrix. PCA set its coefficient to 0 everywhere.

  • With 1 as a constant across all variables, it adds no information to the PC.

We can add the sum of the squares of the coefficients for each combination.

Show code
map_dbl(as.data.frame(pc$rotation), ~ sum(.^2))
 PC1  PC2  PC3  PC4  PC5  PC6  PC7  PC8  PC9 PC10 PC11 PC12 PC13 
   1    1    1    1    1    1    1    1    1    1    1    1    1 

So, the constraint was met for the coefficients of each linear combination.

When we use summary(pc) see results for the \(p\) principal components.

Show code
summary(pc)
Importance of components:
                             PC1      PC2      PC3      PC4      PC5     PC6
Standard deviation     1008.6875 47.90587 20.39692 13.64754 10.56832 9.20740
Proportion of Variance    0.9969  0.00225  0.00041  0.00018  0.00011 0.00008
Cumulative Proportion     0.9969  0.99913  0.99954  0.99972  0.99983 0.99992
                           PC7     PC8   PC9   PC10   PC11   PC12 PC13
Standard deviation     8.19789 3.70100 1.361 0.8419 0.8006 0.4848    0
Proportion of Variance 0.00007 0.00001 0.000 0.0000 0.0000 0.0000    0
Cumulative Proportion  0.99998 1.00000 1.000 1.0000 1.0000 1.0000    1

It shows both the proportion of variance in the \(\bf{X}\) explained by each component and the cumulative proportion as you go from the first PC to the \(p\)th component.

It is common to use a scree plot to see this cumulative sum.

screeplot(pc)

In this case the first principal component dominates the others.

If we look at the coefficients, we see that the PC1 coefficient is almost -1 which dominates the others.

Show code
pc$rotation[,1] |> round(3)
(Intercept)     OUTLOOK      NEWCAP       VALUE    COSTGOOD       WAGES 
      0.000       0.000      -0.022      -0.999       0.002      -0.001 
        ADS    TYPEFOOD       SEATS       OWNER      FTEMPL      PTEMPL 
      0.000       0.000      -0.045       0.000      -0.019      -0.006 
       SIZE 
      0.000 
  • This means PC1 is almost exactly the same as VALUE.

If we look at the original \(X\) values, we can see why.

Show code
head(restdf)
# A tibble: 6 × 13
  OUTLOOK SALES NEWCAP VALUE COSTGOOD WAGES   ADS TYPEFOOD SEATS OWNER FTEMPL
    <dbl> <dbl>  <dbl> <dbl>    <dbl> <dbl> <dbl>    <dbl> <dbl> <dbl>  <dbl>
1       2   480      0   600       35    25     2        2   200     3      8
2       4   507     22   375       59    20     5        2   150     1      6
3       5   210     25   275       40    24     3        1    46     1      0
4       5   246     NA    80       43    30     1        1    28     3      2
5       2   148     NA    85       45    35     1        3    44     1     NA
6       3    50     NA   135       40    30    10        2    50     3      2
# ℹ 2 more variables: PTEMPL <dbl>, SIZE <dbl>
  • VALUE has the largest values of the variables. It is measured in 100s where others are in single digits.
  • This means VALUE2 overwhelms any contribution of the others to maximizing the variance.

Let’s re-scale the variables prior to the calculation and leave out the intercept.

  • If we left in the intercept it could not scale that column since it has 0 std deviation so it would error out

  • Setting scale = TRUE scales each variable

    • It first subtracts the sample mean for each variable from that variable’s observation and then divides each observation by the variable’s sample standard deviation.
pc_s <- prcomp(X[,-1], scale = TRUE)
pc_s
Standard deviations (1, .., p=12):
 [1] 2.0523080 1.2440877 1.0452311 1.0103023 0.9760265 0.9309658 0.8689789
 [8] 0.7896565 0.5615082 0.5574862 0.4796679 0.2699784

Rotation (n x k) = (12 x 12):
                  PC1         PC2         PC3         PC4           PC5
OUTLOOK   0.129952395 -0.18705705 -0.46123048 -0.33005878  0.0365375999
NEWCAP    0.366190985  0.27409788 -0.07922301 -0.24325007  0.2978453780
VALUE     0.401098541  0.37670651  0.01602081  0.03507410  0.1115127452
COSTGOOD -0.167302979  0.43794454  0.16758943  0.02764901 -0.2286376805
WAGES     0.162799535 -0.29947302 -0.05693609 -0.59492623  0.1880523597
ADS       0.024039844 -0.05166599  0.80256459 -0.40250500  0.0003314336
TYPEFOOD -0.003439503 -0.30423302  0.19108383  0.45360618  0.7366581974
SEATS     0.407264328  0.08677937  0.17535601  0.12895704 -0.0659544571
OWNER     0.231842573 -0.41878145  0.18997910  0.03970378 -0.2239534856
FTEMPL    0.412704326  0.27534696 -0.01903357  0.05807844  0.1597581624
PTEMPL    0.348759885 -0.14959474  0.01733899  0.21841539 -0.3377523801
SIZE      0.348538732 -0.30027073 -0.03574775  0.19724400 -0.2703872387
                 PC6          PC7         PC8         PC9         PC10
OUTLOOK  -0.76967949 -0.123987537  0.02949480 -0.05062049 -0.059597130
NEWCAP    0.03546225 -0.009912982 -0.09414570  0.06081283  0.486689601
VALUE    -0.02467414  0.153834496  0.01254067  0.18895113  0.005626471
COSTGOOD -0.15801590 -0.709328654 -0.39851683  0.05603440  0.062632617
WAGES     0.49053613 -0.387886298 -0.05744032  0.13318407 -0.211609634
ADS      -0.28378138  0.071688626  0.24431263 -0.14012858  0.132714989
TYPEFOOD -0.15554106 -0.294271083 -0.03326763  0.07331045  0.039309855
SEATS    -0.09222701 -0.097816108  0.04907506 -0.08136815 -0.747829828
OWNER    -0.09553175  0.260017303 -0.72783620  0.26849696  0.062021597
FTEMPL    0.04583314  0.125454622 -0.15236571 -0.23028862 -0.034047837
PTEMPL   -0.01595179 -0.235243478  0.45848310  0.57341917  0.205202345
SIZE      0.12417816 -0.259366106  0.04028607 -0.67200800  0.292106752
                PC11         PC12
OUTLOOK  -0.10023111 -0.017458371
NEWCAP    0.60508330  0.140377146
VALUE    -0.30031450 -0.730024723
COSTGOOD -0.07132764 -0.002502437
WAGES    -0.17522216 -0.060574642
ADS      -0.08833200  0.014858889
TYPEFOOD -0.04605289 -0.039468516
SEATS     0.43158725  0.047492265
OWNER     0.02269321 -0.010694903
FTEMPL   -0.54075127  0.580467265
PTEMPL   -0.09240574  0.220563561
SIZE      0.01385568 -0.231600605
summary(pc_s)
Importance of components:
                         PC1   PC2     PC3     PC4     PC5     PC6     PC7
Standard deviation     2.052 1.244 1.04523 1.01030 0.97603 0.93097 0.86898
Proportion of Variance 0.351 0.129 0.09104 0.08506 0.07939 0.07222 0.06293
Cumulative Proportion  0.351 0.480 0.57102 0.65608 0.73546 0.80769 0.87062
                           PC8     PC9   PC10    PC11    PC12
Standard deviation     0.78966 0.56151 0.5575 0.47967 0.26998
Proportion of Variance 0.05196 0.02627 0.0259 0.01917 0.00607
Cumulative Proportion  0.92258 0.94885 0.9748 0.99393 1.00000
screeplot(pc_s)

The scree plot looks more typical as most PCs add some information to the model.

  • However, using the smallest PCs can also contribute to overfitting.

We have to decide how many PCs we want to use moving forward.

Important

The number of PCs to use is a tuning parameter.

We can choose manually or we can use cross validation to assist.

6.9.3.2 Example: Principle Components Regression (PCR)

We will use the {pls} (Partial Least Squares) package for PCA Regression.

library(pls)
  • The cumulative proportion from summary() can help us choose how many PCs to use in our regression.
summary(pc_s) 
Importance of components:
                         PC1   PC2     PC3     PC4     PC5     PC6     PC7
Standard deviation     2.052 1.244 1.04523 1.01030 0.97603 0.93097 0.86898
Proportion of Variance 0.351 0.129 0.09104 0.08506 0.07939 0.07222 0.06293
Cumulative Proportion  0.351 0.480 0.57102 0.65608 0.73546 0.80769 0.87062
                           PC8     PC9   PC10    PC11    PC12
Standard deviation     0.78966 0.56151 0.5575 0.47967 0.26998
Proportion of Variance 0.05196 0.02627 0.0259 0.01917 0.00607
Cumulative Proportion  0.92258 0.94885 0.9748 0.99393 1.00000
(100*(pc_s$sdev^2/sum(pc_s$sdev^2)) |> round(2)) |> cumsum()
 [1]  35  48  57  66  74  81  87  92  95  98 100 101

For now, let’s just try using the first six principal components which explains over 80% of the variance.

  • You always start with the first PC and work your way up. You do not pick and choose which PCs to use.

Having made a choice, we now run a regression on the six \(Z_j\).

Let’s use the pls::pcr() function (Principal Components Regression).

  • Conceptually it replaces the data for the regression with the output from the prcomp().

Let’s run first with the original data \(\bf{X}\).

pcr_reg <- pcr(SALES ~ ., data = restdf)
summary(pcr_reg)
Data:   X dimension: 179 12 
    Y dimension: 179 1
Fit method: svdpc
Number of components considered: 12
TRAINING: % variance explained
       1 comps  2 comps  3 comps  4 comps  5 comps  6 comps  7 comps  8 comps
X        99.69    99.91    99.95    99.97    99.98    99.99   100.00   100.00
SALES    72.76    74.22    74.42    74.59    74.69    77.64    79.82    79.82
       9 comps  10 comps  11 comps  12 comps
X       100.00    100.00    100.00    100.00
SALES    79.87     79.88     80.09     80.36

We get similar results as before with SALES overwhelming the other variables just due to its relative magnitude.

Rerun with scale = TRUE.

pcr_reg <- pcr(SALES ~ ., data = restdf, scale = TRUE)
summary(pcr_reg)
Data:   X dimension: 179 12 
    Y dimension: 179 1
Fit method: svdpc
Number of components considered: 12
TRAINING: % variance explained
       1 comps  2 comps  3 comps  4 comps  5 comps  6 comps  7 comps  8 comps
X         35.1    48.00     57.1    65.61    73.55    80.77    87.06    92.26
SALES     65.5    76.47     76.5    76.99    76.99    77.07    77.31    77.31
       9 comps  10 comps  11 comps  12 comps
X        94.89     97.48     99.39    100.00
SALES    78.15     78.20     80.20     80.36

The first row looks familiar – the proportion of the variance in \(\bf{X}\) explained by the PCs.

The second row is the the proportion of the variance in \(\vec{Y}\) explained by the PCs.

  • The first PC explains 65.5% of the variation of SALES.
  • The first two PCs explain 76.5% of the variation of SALES.
  • All 12 PCs explain 80.36% of the variation in \(\vec{Y}\).

Why do we not get over 80%?

Show code
summary(lm(SALES ~ ., data = restdf))

Call:
lm(formula = SALES ~ ., data = restdf)

Residuals:
    Min      1Q  Median      3Q     Max 
-1070.6   -63.9     1.1    68.1  3460.2 

Coefficients:
             Estimate Std. Error t value Pr(>|t|)    
(Intercept) -11.53928  177.67306  -0.065  0.94829    
OUTLOOK       9.64165   18.28185   0.527  0.59863    
NEWCAP        1.68976    1.39700   1.210  0.22817    
VALUE         0.20032    0.06951   2.882  0.00447 ** 
COSTGOOD      2.58492    2.05603   1.257  0.21043    
WAGES        -2.67676    2.86046  -0.936  0.35075    
ADS          -4.24638    6.80094  -0.624  0.53323    
TYPEFOOD    -41.40124   30.90306  -1.340  0.18217    
SEATS         0.26866    0.62638   0.429  0.66854    
OWNER        26.95380   30.66442   0.879  0.38068    
FTEMPL       15.36679    2.91718   5.268 4.24e-07 ***
PTEMPL       14.28713    2.96274   4.822 3.19e-06 ***
SIZE        -72.75924   50.24882  -1.448  0.14951    
---
Signif. codes:  0 '***' 0.001 '**' 0.01 '*' 0.05 '.' 0.1 ' ' 1

Residual standard error: 330.4 on 166 degrees of freedom
  (100 observations deleted due to missingness)
Multiple R-squared:  0.8036,    Adjusted R-squared:  0.7894 
F-statistic: 56.61 on 12 and 166 DF,  p-value: < 2.2e-16
Important

Using \(p\) components has all the information in \(\bf{X}\), and no more, so is the same as doing linear regression on the un-transformed data.

So what is the advantage of PCA and PCR?

  • We can explain 80% of the response with standard linear regression using \(p=12\).

  • We can explain 77% of the response with PCR using only \(p=4\).

  • PCR enables us to reduce the dimensions by a lot with a small loss in the percentage of explained variance.

6.9.3.3 Example Using Cross Validation

How to choose the best number of PCs to use?

This calls for some tuning.

  • We usually tune to achieve the best prediction accuracy.
  • We now want to tune to achieve the lowest Mean Squared Error.
  • We can still use Cross Validation to get the lowest prediction mean squared error.

The good news; it is built into pls::pcr()!

  • Use the argument validation = "CV".
  • The number and type of cross-validation segments are specified with the arguments segments and segment.type.
  • The default is \(K=10\)-fold cross validation.
  • You could also choose validation = "LOO" for LOOCV.
set.seed(1234) # for the cross validation sampling
pcr_reg <- pcr(SALES ~ ., data = restdf, scale = TRUE,
               validation = "CV")
summary(pcr_reg)
Data:   X dimension: 179 12 
    Y dimension: 179 1
Fit method: svdpc
Number of components considered: 12

VALIDATION: RMSEP
Cross-validated using 10 random segments.
       (Intercept)  1 comps  2 comps  3 comps  4 comps  5 comps  6 comps
CV           721.9    486.7    464.8    404.8      404    424.6    432.5
adjCV        721.9    482.2    454.5    401.2      400    419.7    426.9
       7 comps  8 comps  9 comps  10 comps  11 comps  12 comps
CV       434.1    474.9    487.5     483.5     453.8     422.4
adjCV    428.2    465.9    476.1     473.8     443.9     415.4

TRAINING: % variance explained
       1 comps  2 comps  3 comps  4 comps  5 comps  6 comps  7 comps  8 comps
X         35.1    48.00     57.1    65.61    73.55    80.77    87.06    92.26
SALES     65.5    76.47     76.5    76.99    76.99    77.07    77.31    77.31
       9 comps  10 comps  11 comps  12 comps
X        94.89     97.48     99.39    100.00
SALES    78.15     78.20     80.20     80.36

The bottom is what we have seen before – PCR on the full training set.

The top part is the result of the \(K=10\)-fold cross validation.

  • It reports RMSEP: Root Mean Square Error of Prediction which is what we want.
  • For each PC it shows the standard CV RMSEP and the adjusted CV RMSEP for using the smaller samples, as we saw before with \(K\)-fold cross validation.
  • They are generally close and it should not matter which you use to find the smallest RMSEP.

Here it looks like using 4 PCs produces the smallest RMSEP.

  • Note, with a different seed, it may show 3 as having the lowest RMSEP.
  • So either 3 or 4 could work.

The lower the RMSEP, the tighter the prediction intervals you would make.

6.9.3.4 Example of Prediction with PCR

Once you have used cross-validation and selected a number of components, rerun the PCR with that number of components.

pcr_reg <- pcr(SALES ~ ., data = restdf, scale = TRUE,
               ncomp = 4)

Now use predict with set of data.

predict(pcr_reg, restdf[1:10,])
, , 1 comps

       SALES
1   880.6009
2   484.3626
3   197.3813
4         NA
5         NA
6         NA
7  -290.8450
8   143.8381
9         NA
10  280.2190

, , 2 comps

      SALES
1  668.9037
2  649.0121
3  313.5566
4        NA
5        NA
6        NA
7  164.2351
8  261.0915
9        NA
10 200.0450

, , 3 comps

      SALES
1  662.8125
2  645.8301
3  328.5486
4        NA
5        NA
6        NA
7  150.7121
8  266.9354
9        NA
10 207.9064

, , 4 comps

      SALES
1  740.4431
2  667.4594
3  277.0212
4        NA
5        NA
6        NA
7  197.3486
8  281.5636
9        NA
10 250.4511
  • by not specifying the number of components it will create a matrix of the predictions for each observation for each number of PCs up to the number in the model.

We can specify for the number we selected as well to get a single vector of predictions.

predict(pcr_reg, restdf[1:10,], ncomp = 4)
, , 4 comps

      SALES
1  740.4431
2  667.4594
3  277.0212
4        NA
5        NA
6        NA
7  197.3486
8  281.5636
9        NA
10 250.4511
  • You can use this vector to calculate the MSEP manually if you have a validation set, mean((pred - test$value))^2), or with MSEP if you have a cross-validated model.

What do the NAs mean?

  • Look at the data.
map_dbl(restdf[1:10,], ~ sum(is.na(.)))
 OUTLOOK    SALES   NEWCAP    VALUE COSTGOOD    WAGES      ADS TYPEFOOD 
       0        0        3        0        1        1        1        1 
   SEATS    OWNER   FTEMPL   PTEMPL     SIZE 
       1        0        1        2        2 

Get the summary() for the model with four PCs

Show code
summary(pcr_reg)
Data:   X dimension: 179 12 
    Y dimension: 179 1
Fit method: svdpc
Number of components considered: 4
TRAINING: % variance explained
       1 comps  2 comps  3 comps  4 comps
X         35.1    48.00     57.1    65.61
SALES     65.5    76.47     76.5    76.99

So our \(r^2 = 77\%\) is lower than we could get with full model at \(80\%\).

  • However, cross validation told us that 12 PCs was too flexible, it had lower predictive power (higher MSE) than with 4, so we go with 4.

This shows the benefits of using cross-validation in tuning our models.

\(K\)-Fold CV with \(K=10\) using the adjusted CV outcome is quite popular for balancing the bias-variance trade-off of losing 10% of the data versus 100% with correlated \(\bf{X}\) seen with LOOCV.

6.9.4 Theory Behind Constructing the Principal Components

Tip

It may be useful to refer to Section A.15 for what follows.

We want to maximize the variance of the linear combinations so a good place to start is with the variance-covariance matrix of the \(\bf{X}\).

\[ \text{Cov}(\bf{X}) = V = \begin{pmatrix} \text{Var}X_1 &\text{Cov}(X_1, X_2)& \ldots& \text{Cov}(X_1, X_p)\\ \text{Cov}(X_2, X_1) &\text{Var}X_2& \ldots &\text{Cov}(X_2, X_p)\\ \vdots&&\ddots&\vdots \\ \text{Cov}(X_p, X_1) &\text{Cov}(X_P, X_2)& \ldots &\text{Var}(X_p) \end{pmatrix} \tag{6.20}\]

  • Equation 6.20 is a non-negative, definite matrix of dimension \(p \times p\).
    • An \(n\times n\) real symmetric matrix \(A\) is non-negative definite (aka positive semi-definite) provided \(x^TXx\geq 0 \,\,\forall x\in\mathbb{R}\).
    • A matrix \(A\) is non-negative definite \(\iff\) the eigenvalues of \(A\) are non-negative.
    • This characteristic is important as it means it has nice properties for differentiation and optimization.

Thus we know the variance-covariance matrix for \(Z_k\), \(V\), has

  • \(p\) eigenvalues: \(\lambda_1\geq \lambda_2\geq\ldots\geq\lambda_p\), and the associated
  • \(p\) eigenvectors: \(\vec{e}_1, \vec{e}_2, \ldots, \vec{e}_p\).

By the definition of eigenvalues and eigenvectors, we know

\[V\vec{e}_j = \lambda_j\vec{e}_j \tag{6.21}\]

and,

  • all eigenvectors are orthogonal to each other, i.e. \(\vec{e}'_i\,\vec{e}_j = 0\),
  • all eigenvectors can be normalized so the norm of each eigenvector = 1, i.e.,

\[||\vec{e}_j||_2 = \vec{e}'_j\,\vec{e}_j = 1 \tag{6.22}\]

6.9.4.1 Constructing the First Principal Component

To construct the First PC, start with the idea that we want to maximize the variance of \(Z_1\).

Describe the variance of the linear combination \(Z_1\) as a matrix (using the fact that \(\text{Var}(aX) = a^2\text{Var}(X)\) or, in matrix terms, \(\text{Cov}(\vec{a}'\bf{X}) = \vec{a}'\text{Cov}(X)\vec{a}\) where \(\vec{a}'\) is the transpose of \(\vec{a}\).

Therefore, we want to maximize the following:

\[\text{Var}(Z_1) = \text{Var}\left(\sum a_j X_j)\right) = \text{Var}(\vec{a}'\bf{X}) = a'Va \tag{6.23}\]

since we defined \(\text{Var}(\bf{X}) = \bf{V}\) in Equation 6.20.

We can now use the fact that the set of eigenvectors \(\vec{e}_j\) is a basis for the \(\mathbb{R}^p\) containing the matrix \(\bf{X}\).

Since any vector in \(\mathbb{R}^p\) can be written as a linear combination of a set of basis vectors, here the eigenvectors, we know there are some scalars \(\alpha_j\) such that

\[\vec{a} = \sum\alpha_j\vec{e}_j \tag{6.24}\]

Starting with Equation 6.23, let’s use Equation 6.24 and replace the \(\vec{a}\) coefficients with their eigenvector representation and then rearrange terms to get the following:

\[ \begin{align} \text{Var}(Z_1) &= a'Va \\ \\ &= \sum_j\sum_k \alpha_j\alpha_k \vec{e}'_j\underbrace{V\vec{e}_k}_{Ve_k = \lambda_ke_k} \end{align} \]

  • We can now replace the matrix \(\times\) eigenvector term on the right by the scaled eigenvector representation from Equation 6.21 and move the \(\lambda_k\) to the front to get:

\[ \begin{align} \text{Var}(Z_1) &=\sum_j\sum_k \lambda_k \alpha_j \alpha_k\underbrace{\vec{e}'_j\vec{e}_k}_{0 \text{ if } j \neq k\text{ given orthogonality}\,\\ 1 \text{ if }j = k \text{ given scaling}} \\ \\ &\text{separate the two cases for } j=k, j\neq k \\\\ \text{Var}(Z_1) &=\begin{cases}\sum_k \lambda_k \alpha_k^2 & j = k\\ 0 & j \neq k\end{cases}\\ \\ &\text{to maximise } \text{Var}(Z_1) \text{ we won't need the 0 case}\longrightarrow \\\\ \text{Max}\,\text{Var}(Z_1) &=\sum_k \lambda_k \alpha_k^2 \quad \text{ subject to }\sum a_j^2 = \sum\alpha_k^2 = 1 \end{align} \tag{6.25}\]

So how can we maximize Equation 6.25?

The first eigenvalue is always the largest, \(\lambda_1 \geq \lambda_i \,i=2, \ldots, p\).

We can maximize by setting \(\alpha_1 = 1\).

  • This means all the other \(\alpha_i = 0\).

Therefore:

\[\text{Var}(Z_1) = \lambda_1 \quad \text{and} \quad \vec{a} = \sum{\alpha_j\vec{e}_j} = \vec{e}_1\]

The first Principal Component is the first eigenvector!

6.9.4.2 Constructing the Second Principal Component

Let’s summarize how we got here.

To start PCA, we scaled our data so \(\tilde{x}_{i,j}\) is the scaled value of the ith observation for variable \(X_j\).

\[\text{Data} = \vec{X}_i, \ldots,\vec{X}_p \rightarrow \text{ scale } \tilde{x}_{ij} = \frac{x_{ij} - \bar{x}_j}{s_{X_j}}\quad j = 1, \ldots, p\]

We constructed the \(p\) principal components, \(Z_k\), for the \(\bf{X}\) and then calculated \(Z_{ki}\) for each observation \(i\).

  • Each observation has its own value for principal component \(Z_k\) based on the linear combination of \(a_{kj}\) and \(\tilde{x}_{ij}\).

  • The \(a_{kj}\) are the same for all observations for a given \(\tilde{\vec{X}}_j\) , i.e.,

\[Z_{1i} = \sum a_{1j} \tilde{x}_{ij} \\Z_{2i} = \sum a_{2j} \tilde{x}_{ij} \\ \vdots\\Z_{pi} = \sum a_{pj} \tilde{x}_{ij}\]

We now have the transformed \(\bf{X}\) in terms of principal components.

We conducted PCR to see how the PCs explain the variance in \(\vec{Y}\).

\[y_i = \beta_0 + \beta_1Z_{1i} + \beta_z Z_{2i} + \cdots + \beta_k Z_{ki} \quad k \leq p\]

We used cross-validation \((K=10)\) to choose the number of PCs to use, \(k\), by minimizing prediction mean squared error.

We constructed the linear combination \(Z_k = \sum a_{kj} \tilde{X}_j = \vec{a}_k'X\) for first principal component \(Z_1\) by finding the values for \(a_{1j}\) that maximized the variance of \(Z_1\) subject to \(\sum a_{1j} \leq 1\).

We saw that the solution was to find the \(p\) eigenvalues of the (estimated) variance-covariance matrix for \(Z\), order them from largest to smallest, \((\lambda_k>0)\), and select the largest one since it has the largest variance.

We got the result \(Ve_j = \lambda_je_j\) by definition of the eigenvalue and its associated eigenvector.

The first principle component was then constructed by using the eigenvector for the largest eigenvalue (as described by using them as a basis) and using its elements as the \(a_{1j}\).

That gave us:

\[\vec{a}_1 = \vec{e}_1 \\ \bf{Z}_{1} = \vec{e}_1'\bf{X}\\ \text{Var}(Z_1) = \lambda_1\]

We are now ready for the Second principal component \(Z_2\).

6.9.4.2.1 Definition of the Second PC

It must be a linear combination of \(\bf{X}\) where it has to now meet three conditions.

\[Z_2 = \sum a_{2j} \tilde{X}_j = a_2'X\]

  1. Maximizes the \(\text{Var}Z_2\) subject to
  2. \(\sum a_{2j} \leq 1\) and
  3. \(\text{Cov}(Z_1, Z_2) = 0\) so it contains no information from \(Z_1\).
6.9.4.2.2 Derivation of the Second PC Solution

The eigenvectors \(\vec{e_1}, \ldots, e_{p}\) are orthogonal and form a basis for \(\mathbb{R}^P\).

  • As a basis, we can describe any other vector as a linear combination of the eigenvectors.

Let’s decompose \(\vec{a_2}\) as a linear combination of the eigenvectors so \(\vec{a}_2 = \sum a_{2j} e_{j}\).

We can then maximize the variance of \(Z_2\).

\[ \begin{align} \text{Var}(Z_2) &= \text{Var}(a_2'\bf{X}) = a_2'V'a_2 = \sum_j\sum_k \alpha_{2j}\alpha_{2k} e_j'\underbrace{Ve_k}_{\lambda_k e_k}\\ \text{Var}(Z_2) &=\sum_j\sum_k \lambda_k \alpha_{2j}\alpha_{2k} \underbrace{e_j'e_k}_{0 \text{ if } j \neq k\text{ orthogonality}\,\\ 1 \text{ if }j = k}\\ \text{Var}(Z_2) &=\sum_j \lambda_j \alpha_{2j}^2\end{align} \tag{6.26}\]

Now we need to maximize Equation 6.26 subject to our conditions.

  • Let’s start with \(\text{Cov}(Z_2, Z_1) = 0\).
  • Follow similar logic from Equation 6.25.

\[ \begin{align} \text{Cov}(Z_2, Z_1) &= \text{Cov}(\vec{a}_2'\bf{X}, \vec{e}_1'\bf{X})\\ \\ &= \vec{a}_2'V\vec{e}_1 = \vec{a}_2'\,\,\lambda_1\vec{e}_1 \\ \\&=\sum \alpha_{2j} \,\,\,\vec{e}_j'\lambda_1e_1 = \sum \lambda_j\alpha_{2j}\vec{e}_j'\vec{e}_1 \\ \text{and we know } &\vec{e}_j'\vec{e}_1 = 1 \text{ when } j = 1, \, 0 \text{ otherwise}\Rightarrow\\ \\\text{Cov}(Z_2, Z_1)&= \lambda_1\alpha_{21} = 0 \iff \alpha_{21} = 0. \end{align} \tag{6.27}\]

Equation 6.27 tells us we must set \(\alpha_{21} = 0\) to meet the orthogonality constraint for our PCs.

Let’s maximize \(\text{Var}(Z_2) =\sum_{j=2}^p \lambda_j \alpha_{2j}^2\) where

  • \(\sum\alpha_{2j} = 1\) and now \(\alpha_{21} = 0\).

How could we maximize this?

  • We know \(\lambda_i >\lambda_j \quad \forall i<j\) so, like before, we will put all the value into \(\alpha_{22}\).

Thus we set \(\alpha_{22} = 1\) and all others are zero.

Results: \(\text{Var}(Z_2) = \lambda_2\), \(\vec{a}_2 = \vec{e}_2\) and \(Z_2 = \vec{e}_2'\bf{X}\).

For each of the \(p\) PCs, there are similar results.

We can calculate the total variance of \(\bf{X}\) explained by the first \(k\) PCs as the sum of their eigenvalues.

We can calculate the percent total variance of \(\bf{X}\) explained by the first \(k\) PCs as the ratio of their total variance explained to the total variance explained by all \(p\) PCs, or,

\[\text{% Total Variance Explained of }\bf{X} = \frac{\lambda_1 + \cdots + \lambda_k}{\lambda_1 + \cdots + \lambda_p}.\]

This theoretical review helps us understand why PCA and PCR work and gives us some insights into how computational algorithms are designed for their implementation.

Next we will discuss Partial Least Squares.

6.10 Partial Least Squares Regression (PLS)

PLS is a supervised method for obtaining principal components.

The goal is improving the prediction of the response.

Instead of maximizing the variance of \(Z_j\) the goal is to

\[ \text{Maximize } \text{Cov}(\vec{Z}, \vec{Y}). \tag{6.28}\]

Equation 6.28 represents the idea that we want to find the linear combinations of \(\bf{X}\) that are most useful in predicting \(\vec{Y}\).

  • The other constraints are the same as PCR.
  • The linear combinations must be uncorrelated with each other.

By choosing PLS PCs, a PLS model can usually explain more variance of \(\vec{Y}\) with fewer principal components.

6.10.1 Example of PLS using R

Lets revisit the restaurant data for a quick example in R.

We still use the {pls} package.

Here is the PCR solution with 12 PCs.

Show code
restdf <- read_csv("https://raw.githubusercontent.com/rressler/data_raw_courses/main/Restaurants.csv")
pcr_reg <- pcr(SALES ~ ., data = restdf, scale = TRUE, ncomp = 12)
summary(pcr_reg)
Data:   X dimension: 179 12 
    Y dimension: 179 1
Fit method: svdpc
Number of components considered: 12
TRAINING: % variance explained
       1 comps  2 comps  3 comps  4 comps  5 comps  6 comps  7 comps  8 comps
X         35.1    48.00     57.1    65.61    73.55    80.77    87.06    92.26
SALES     65.5    76.47     76.5    76.99    76.99    77.07    77.31    77.31
       9 comps  10 comps  11 comps  12 comps
X        94.89     97.48     99.39    100.00
SALES    78.15     78.20     80.20     80.36

It takes 11 PCs to explain 80% of the variance of SALES.

Finding the PLS solution only requires changing the function to pls::plsr().

Show code
pls_reg <- plsr(SALES ~ ., data = restdf, scale = TRUE, ncomp = 12)
summary(pls_reg)
Data:   X dimension: 179 12 
    Y dimension: 179 1
Fit method: kernelpls
Number of components considered: 12
TRAINING: % variance explained
       1 comps  2 comps  3 comps  4 comps  5 comps  6 comps  7 comps  8 comps
X        34.59    47.64    52.11    58.16    63.98    67.30    72.84    76.88
SALES    72.88    78.41    79.91    80.27    80.31    80.34    80.35    80.36
       9 comps  10 comps  11 comps  12 comps
X        84.28     89.68     94.82    100.00
SALES    80.36     80.36     80.36     80.36

Now we see we can get to 80% with just four principal components.

We can add the cross-validation as well to identify the best number of coefficients using the Adjusted CV.

Show code
pls_reg <- plsr(SALES ~ ., data = restdf, scale = TRUE, ncomp = 12,
                validation = "CV")
summary(pls_reg)
Data:   X dimension: 179 12 
    Y dimension: 179 1
Fit method: kernelpls
Number of components considered: 12

VALIDATION: RMSEP
Cross-validated using 10 random segments.
       (Intercept)  1 comps  2 comps  3 comps  4 comps  5 comps  6 comps
CV           721.9    469.3    456.7    487.8    474.1    462.3    467.7
adjCV        721.9    462.7    448.3    476.0    463.3    452.6    457.6
       7 comps  8 comps  9 comps  10 comps  11 comps  12 comps
CV       470.4    475.7    476.4     476.5     476.5     476.5
adjCV    460.2    465.1    465.8     465.8     465.8     465.8

TRAINING: % variance explained
       1 comps  2 comps  3 comps  4 comps  5 comps  6 comps  7 comps  8 comps
X        34.59    47.64    52.11    58.16    63.98    67.30    72.84    76.88
SALES    72.88    78.41    79.91    80.27    80.31    80.34    80.35    80.36
       9 comps  10 comps  11 comps  12 comps
X        84.28     89.68     94.82    100.00
SALES    80.36     80.36     80.36     80.36

The CV results suggest using two principal components.

The validationplot() function shows the change in RMSEP as a function of the number of components in cross validation model.

Show code
validationplot(pls_reg)

The functions \(R2\) and \(MSEP\) provide the \(R^2\) values and \(MSEP\) for components as well.

  • They allow for the estimates to be based on the training data, cross-validation results, or new test data.
  • When cross-validation results are in the output object from pls() or plsr(), that is the default output, unless new test data is provided.
Show code
R2(pls_reg)
(Intercept)      1 comps      2 comps      3 comps      4 comps      5 comps  
   -0.01127      0.57256      0.59522      0.53825      0.56393      0.58525  
    6 comps      7 comps      8 comps      9 comps     10 comps     11 comps  
    0.57563      0.57057      0.56088      0.55954      0.55951      0.55948  
   12 comps  
    0.55949  
Show code
R2(pls_reg, estimate = "CV")
(Intercept)      1 comps      2 comps      3 comps      4 comps      5 comps  
   -0.01127      0.57256      0.59522      0.53825      0.56393      0.58525  
    6 comps      7 comps      8 comps      9 comps     10 comps     11 comps  
    0.57563      0.57057      0.56088      0.55954      0.55951      0.55948  
   12 comps  
    0.55949  
Show code
R2(pls_reg, estimate = "train")
(Intercept)      1 comps      2 comps      3 comps      4 comps      5 comps  
     0.0000       0.7288       0.7841       0.7991       0.8027       0.8031  
    6 comps      7 comps      8 comps      9 comps     10 comps     11 comps  
     0.8034       0.8035       0.8036       0.8036       0.8036       0.8036  
   12 comps  
     0.8036  
Show code
MSEP(pls_reg)
       (Intercept)  1 comps  2 comps  3 comps  4 comps  5 comps  6 comps
CV          521178   220289   208612   237973   224737   213752   218709
adjCV       521178   214123   200930   226565   214679   204882   209394
       7 comps  8 comps  9 comps  10 comps  11 comps  12 comps
CV      221314   226307   227000    227016    227032    227029
adjCV   211766   216302   216933    216948    216963    216959
Show code
MSEP(pls_reg, estimate = "CV")
(Intercept)      1 comps      2 comps      3 comps      4 comps      5 comps  
     521178       220289       208612       237973       224737       213752  
    6 comps      7 comps      8 comps      9 comps     10 comps     11 comps  
     218709       221314       226307       227000       227016       227032  
   12 comps  
     227029  
Show code
MSEP(pls_reg, estimate = "adjCV")
(Intercept)      1 comps      2 comps      3 comps      4 comps      5 comps  
     521178       214123       200930       226565       214679       204882  
    6 comps      7 comps      8 comps      9 comps     10 comps     11 comps  
     209394       211766       216302       216933       216948       216963  
   12 comps  
     216959  
Show code
MSEP(pls_reg, estimate = "train")
(Intercept)      1 comps      2 comps      3 comps      4 comps      5 comps  
     515371       139756       111292       103513       101668       101467  
    6 comps      7 comps      8 comps      9 comps     10 comps     11 comps  
     101311       101254       101209       101207       101207       101207  
   12 comps  
     101207  
Important

PLS can reduce dimensions more than PCR. It tends to reduce bias but can increase variance so it does not necessarily dominate in the bias-variance trade off.

6.10.2 Computing PLS PCs

Both \(\bf{X}\) and \(\vec{Y}\) are scaled.

PLS computes the first PC, \(Z_1\), by setting each \(a_{1j}\) in the linear combination for \(Z_1\), Equation 6.19, to the coefficient from the single predictor simple linear regression of \(\vec{Y} \sim \vec{X}_j\).

  • This coefficient is proportional to \(\text{Cor}(\vec{Y},\vec{X}_j)\) so PLS is placing the highest weight on the variables most closely related to the response.

PLS computes the second PC, \(Z_2\) in several steps.

  • Regresses each variable on \(Z_1\) and computes the residuals.
    • The residuals are orthogonal to \(Z_1\).
      • They represent the information not explained by \(Z_1\).
  • Uses the residuals to represent the new \(\vec{Y}_\text{resid}\) and regress \(\vec{Y}_\text{resid} \sim \vec{X}_j\).
    • This may be referred to as “deflating” the matrix.
  • Uses these coefficients to create \(Z_2\).

Repeats the same process to obtain the remaining \(Z_j\) up to \(Z_p\).

When all coefficients for the PCs are computed, regress \(\vec{Y}\sim \bf{Z}\) to obtain the final model as in PCR.