3  Statistical Machine Learning: Linear Regression

ISLRv2 Chapter 3

Author
Affiliation

Richard Ressler

American University

Published

April 16, 2024

Professor Baron’s Handout

On canvas you will find Professor Baron’s handout on Linear Regression with a review of material from STAT 415-615.

3.1 Review of the Linear Regression Model

Let \(X_1, \ldots, X_p\). be one or more independent variables (aka predictors). They are typically non-random.

Let \(Y_i\) be a dependent (aka response) variable.

Let \(\epsilon\) be a random variable with mean 0 that is the noise (error or other discrepancies) present in a model.

We have a regression model of

\[ Y = \beta_0 + \beta_1 X_1 + \cdots + \beta_p X_p + \epsilon \tag{3.1}\]

Based on a sample, we estimate the \(p +1\) parameters where \(\beta_0\) is intercept and \(\beta_1, \ldots, \beta_p\) are the slopes.

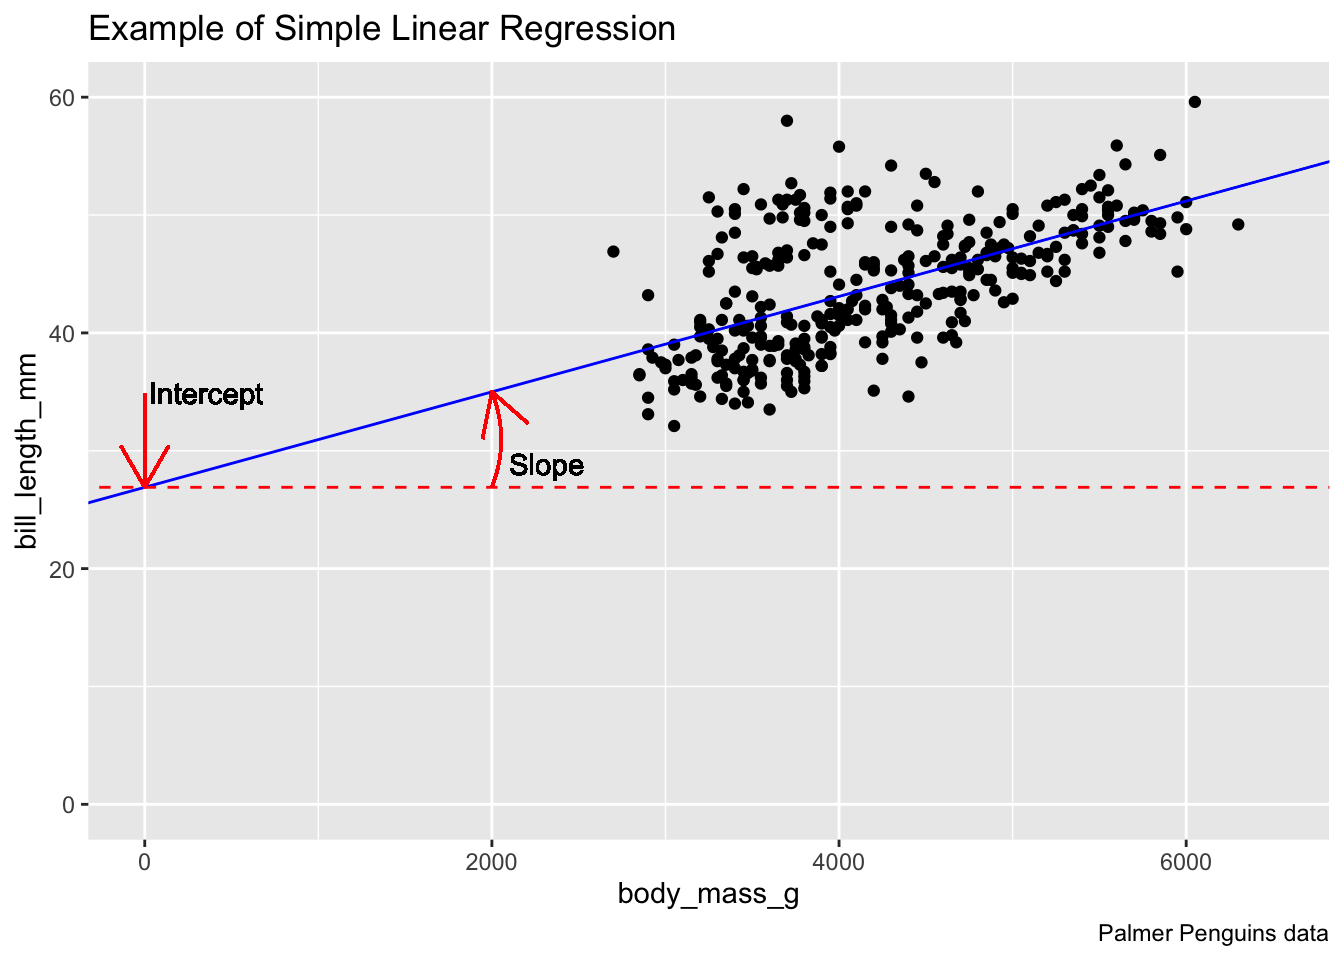
If we have one predictor variable then the model represents a straight line.

Let’s look at the Palmer Penguins data (Horst, Hill, and Gorman 2020) on three species of penguin and plot bill_length_mm vs body_mass_g.

Show code
suppressMessages(library(tidyverse))
suppressMessages(library(palmerpenguins))
data("penguins")
lm_out <- lm(bill_length_mm ~ body_mass_g, data = penguins)
ggplot(penguins, aes(body_mass_g, bill_length_mm)) +
  geom_point() +
  geom_abline(intercept = lm_out$coefficients[1],
              slope = lm_out$coefficients[2],
              color = "blue") +
  coord_cartesian(xlim = c(0, 6500),
                  ylim = c(0, 60)) +
  geom_text(aes(x = 0, y = lm_out$coefficients[1] + 8,
                hjust = "left"),
                label = "Intercept",
            nudge_x = 25) +
  geom_segment(x = 0, y = lm_out$coefficients[1] + 8,
               xend = 0, yend = lm_out$coefficients[1],
               color = "red",
               arrow = arrow()) +
  geom_abline(intercept = lm_out$coefficients[1],
              slope = 0,
              color = "red",
              lty = 2) +
  geom_curve(xend = 2000,
             yend = predict(lm_out, tibble(body_mass_g = 2000)),
             x = 2000, y = lm_out$coefficients[1],
             color = "red",
             curvature = .2,
             arrow = arrow()) +
  geom_text(aes(x = 2000, y = lm_out$coefficients[1],
                hjust = "left"),
                label = "Slope",
            nudge_x = 100, nudge_y = 2) +
  labs(title = "Example of Simple Linear Regression",
       caption = "Palmer Penguins data")

  • What does this graph tell us about the intercept and slope?

If \(p>1\), the interpretation depends upon if the additional \(X_i\) are categorical or quantitative. We’ll talk about categorical predictors and interactions later on.

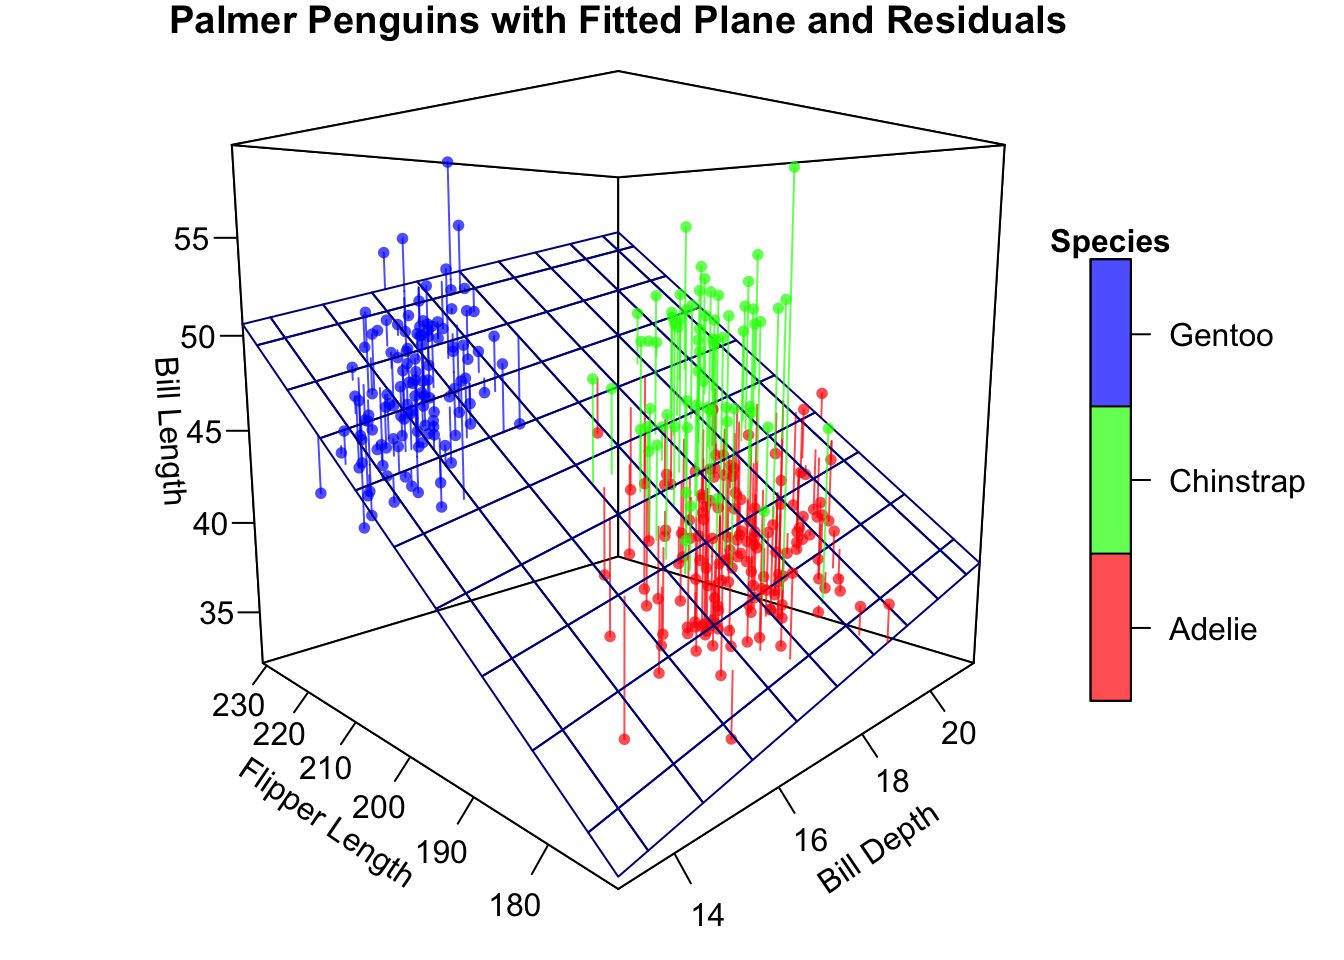
If there are multiple quantitative predictors, the model is fitting a hyper-plane in multi-dimensional space.

3.1.0.1 Palmer Penguins Example of Multiple Continuous Predictors

Consider bill_length_mm vs bill_depth_mm and flipper_length.

  • The figure below uses the {plot3D} package (Soetaert 2021) to access functions for 3D plotting not available in {ggplot2} yet.
  • Assume any interaction terms are not significant so we will ignore them for now.
Show code
## Uses {regplane3D} package 
par(mar = c(1, 1, 1, 1)) # set the margins
p_df <- drop_na(penguins, c(bill_length_mm, bill_depth_mm, flipper_length_mm))
lm_out2 <- lm(bill_length_mm ~ bill_depth_mm + flipper_length_mm,
              data = p_df)
suppressMessages(library(regplane3D))
## Find Range of 1st predictor
range_bd <- range(p_df$bill_depth_mm, na.rm = TRUE)
range_fl <- range(p_df$flipper_length_mm, na.rm = TRUE)
## Determine Axis inputs
axis_bd <- pretty_axis_inputs(axis_range = range_bd,
                              base = 2,
                              nlines_suggest = 6L,
                              multiply = 4)
axis_fl <- pretty_axis_inputs(axis_range = range_fl,
                              base = 2,
                              nlines_suggest = 8L,
                              multiply = 4)
## ---- Prediction ----
pred <-
  array(NA, dim = c(length(axis_bd$seq), 
                    length(axis_fl$seq), 3L))

for (bd in seq_along(axis_bd$seq)) {
  for (fl in seq_along(axis_fl$seq)) {
    pred_tmp <- predict.lm(lm_out2,
                           newdata = data.frame(
                             bill_depth_mm = axis_bd$seq[bd],
                             flipper_length_mm = axis_fl$seq[fl]),
                           se.fit = TRUE
                           )
    pred[bd, fl, ] <- c(
      pred_tmp$fit,
      pred_tmp$fit + qnorm(.025) * pred_tmp$se.fit,
      pred_tmp$fit + qnorm(.975) * pred_tmp$se.fit
    )
  }
}

## ---- Plot ----
#par(mar = c(2.1, 2.1, 4.1, 0.1))
plane3D(
  z = pred,
  x = axis_bd$seq,
  y = axis_fl$seq,
  plane0 = TRUE,
  zlab = "Bill Length",
  xlab = "Bill Depth",
  ylab = "Flipper Length",
  zlim = range(p_df$bill_length_mm),
  xlim = axis_bd$range,
  ylim = axis_fl$range,
  cis = TRUE,
  xnlines = axis_bd$nlines,
  ynlines = axis_fl$nlines,
  main = "Fitted Plane of Bill Length v. Bill Depth and Flipper Length",
  theta = -45,
  phi = 30
)

Show code
suppressMessages(library(plot3D))
par(mar = c(1, 1, 1, 1))
p_fit <- lm(bill_length_mm ~ bill_depth_mm + flipper_length_mm,
             data = p_df)

  # predict values on regular xy grid
   bd.pred <- seq(min(p_df$bill_depth_mm),
                  max(p_df$bill_depth_mm),
                  length.out = 10)
   fl.pred <- seq(min(p_df$flipper_length_mm),
                  max(p_df$flipper_length_mm),
                  length.out = 10)
   p_xy <- expand.grid(bill_depth_mm = bd.pred,
                       flipper_length_mm = fl.pred)

   bl.pred <- matrix(nrow = 10, ncol = 10,
      data = predict(p_fit, newdata = data.frame(p_xy), 
      interval = "prediction")[,1])
Show code
# fitted points for drop lines to surface
  p_fitpoints <- predict(p_fit) 

  scatter3D(z = p_df$bill_length_mm,
             x = p_df$bill_depth_mm,
             y = p_df$flipper_length_mm, pch = 16, cex = .8, 
      theta = -45, phi = 9, ticktype = "detailed",
      alpha = .7,
      colvar = as.integer(p_df$species),
      col = c("red", "green", "blue"), 
      colkey = list(side = 4,length = .5,
                    addlines = TRUE,
                    dist = -.1,
                    at = c(1.33, 2, 2.66), 
                    labels = c("Adelie", "Chinstrap", "Gentoo")),
      clab = "Species",
      xlab = "Bill Depth", ylab = "Flipper Length", 
      zlab = "Bill Length", 
      # surf = list(x = bd.pred, y = fl.pred,
      #             z = bl.pred,
      #             facets = NA, fit = p_fitpoints,
      #             alpha = 1, col = "darkblue"),
      main = "Palmer Penguins") 

Show code
par(mar = c(1, 1, 1, 1)) # set the margins
scatter3D(z = p_df$bill_length_mm,
             x = p_df$bill_depth_mm,
             y = p_df$flipper_length_mm, pch = 16, cex = .8, 
      theta = -45, phi = 9, ticktype = "detailed",
      alpha = .7,
      colvar = as.integer(p_df$species),
      col = c("red", "green", "blue"), 
      colkey = list(side = 4,length = .5,
                    addlines = TRUE,
                    dist = -.1,
                    at = c(1.33, 2, 2.66), 
                    labels = c("Adelie", "Chinstrap", "Gentoo")),
      clab = "Species",
      xlab = "Bill Depth", ylab = "Flipper Length", 
      zlab = "Bill Length", 
      surf = list(x = bd.pred, y = fl.pred,
                  z = bl.pred,
                  facets = NA, fit = p_fitpoints,
                  alpha = 1, col = "darkblue"),
      main = "Palmer Penguins with Fitted Plane and Residuals") 

When we run the linear models and estimate the parameters in Equation 3.1, the model with the estimated parameters is denoted by one of the following equivalents which define the function for the fitted hyper-plane.

\[ \hat{Y} = \hat{\beta}_0 + \hat{\beta}_1 X_1 + \cdots + \hat{\beta}_p X_p \tag{3.2}\]

\[ \hat{Y} = b_0 + b_1 X_1 + \cdots + b_P X_P \tag{3.3}\]

\(\hat{Y}\) is the Predicted response when you plug in the value of the estimates.

3.2 Method of Least Squares Estimation

Least Squares is a method for estimating the unknown parameters \(\beta_0, \beta_1, \ldots, \beta_p\) where we minimize the sum of the squared errors (the differences between the estimated values \(\hat{Y}_i\) and the actual values \(Y_i\) in our training data \(Y_i\)).

\[ MSE = E(\hat{y}_i - y_i)^2 \tag{3.4}\]

Using calculus, we could take the partial derivatives across the parameters, and set each to 0 to find the value that minimizes the sum.

For us, the solution requires solving these \(p + 1\) equations for the partial derivatives where

\[ \frac{\delta MSE }{\delta\beta_k}= 0 \quad\text{for }k = 0, \ldots, p \]

With one equation for each parameter, each equation is a restriction which reduces the MSE degrees of freedom to \(n-(p+1)\).

Using some calculus, the least squares solution for a single \(X\) (Simple Linear Regression) yields

\[ \begin{align} \hat{\beta}_1 & = \frac{\sum(x_i - \bar{x})(y_i - \bar{y})}{\sum(x_i - \bar{x})^2} \\ \hat{\beta}_0 & = \bar{y} - \hat{\beta}_1\bar{x} \end{align} \tag{3.5}\]

For \(p\) predictors \(X_i\), Equation 3.5 is expressed in matrix form as

\[ \hat{\vec{\beta}} = \begin{bmatrix}\hat{\beta}_0 \\ \hat{\beta}_1 \\ \vdots \\ \hat{\beta}_p\end{bmatrix} = (X^TX)^{-1}X^T Y \tag{3.6}\]

We will see Equation 3.6 several times throughout the course as we look at other methods such as ridge regression or lasso.

3.3 Checking “Significance” of the Variables.

Now that we have some estimates for our parameters, we need to check if the variables have predictive value in our model.

One way to do that is with the \(t\)-test.

3.3.1 The \(t\)-test

We start with a Null (Dull) hypothesis of

\[ H_0: \beta_k = 0 \quad \forall k = 0, \ldots, p \]

which means the intercept is 0 and all the slopes are 0, i.e., knowing anything about the predictors does not change our knowledge about the value of the response.

We calculate a \(t\)-statistic as the ratio of the estimated slope to the estimated standard error.

\[ t_{statistic} = \frac{\hat{\beta}_k}{s_{\hat{\beta}_k}} \longrightarrow \text{Compare with the t dist with df } n-(p+1) \tag{3.7}\]

We have a formula for estimating the numerator \(\hat{\beta}_k\) (Equation 3.6).

How do we get the denominator, the standard deviation of the slope estimates, or \(\text{VAR}(\hat{\vec{\beta}})\)?

3.3.2 Standard Error of \(\hat{\beta}_k\) from \(\text{VAR}(\hat{\vec{\beta}})\)

Use a matrix approach to define the variance-covariance matrix for \(\text{VAR}(\hat{\vec{\beta}})\) as

\[ \text{VAR}(\hat{\vec{\beta}}) = \begin{pmatrix}\sigma^2_{\hat{\beta}_0} & & & \\ & \sigma^2_{\hat{\beta}_1} & & \\ \vdots& \vdots& \sigma^2_{\hat{\beta}_k} & \vdots \\ & & & \sigma^2_{\hat{\beta}_p}\end{pmatrix} \]

with the variances of each \(\hat{\beta}_k\) on the diagonal. The covariances between each of the \(\hat{\beta}_i, \hat{\beta}_j\) fill in the off-diagonals.

\[ \text{VAR}(\hat{\vec{\beta}}) = \begin{pmatrix} \sigma^2_{\hat{\beta}_0} &\sigma_{\hat{\beta}_0 \hat{\beta}_1} & \sigma_{\hat{\beta}_0 \hat{\beta}_k}& \sigma_{\hat{\beta}_0 \hat{\beta}_p}\\ \sigma_{\hat{\beta}_1\hat{\beta}_0} &\sigma^2_{\hat{\beta}_1} & \sigma_{\hat{\beta}_1 \hat{\beta}_k}& \sigma_{\hat{\beta}_1 \hat{\beta}_p}\\ \vdots& \vdots& \sigma^2_{\hat{\beta}_k} & \vdots \\ \sigma_{\hat{\beta}_p \hat{\beta}_0}& \sigma_{\hat{\beta}_p \hat{\beta}_1}& \sigma_{\hat{\beta}_p \hat{\beta}_k}& \sigma^2_{\hat{\beta}_p} \end{pmatrix} \tag{3.8}\]

Note that the matrix in Equation 3.8 is symmetric.

We can use assumptions from the standard linear regression model about the vector of observed responses \(\text{VAR}(\vec{Y})\) to simplify the variance-covariance matrix for our observed responses \(Y\).

These include assuming the vector is:

  1. Homeoscedastic - all variances are equal.
  2. Uncorrelated - all covariances are 0.

These assumptions allow us to simplify the variance-covariance matrix for our observed responses \(Y\) as:

\[ \text{VAR}(Y) = \begin{pmatrix}\sigma^2 &0 &0 & 0 \\ 0 & \sigma^2 & 0 & 0 \\ \vdots& \vdots& \sigma^2 & \vdots \\ 0 & 0 & 0 & \sigma^2 \end{pmatrix} = \sigma^2I \tag{3.9}\]

Now we can use Equation 3.9 with Equation 3.6 to develop a formula for \(\text{VAR}(\hat{\vec{\beta}})\) assuming \((X^TX)\) is non-singular.

  • Recall the \(X\) variables are assumed as fixed and non-random so \((X^TX)^{-1}X^T\) is non-random.
  • Let’s call it matrix \(A\).

\[ \begin{align} \text{VAR}(\hat{\vec{\beta}})& = \text{VAR}\left((X^TX)^{-1}X^TY\right) & \text{(3.6)}\\ &= \text{VAR}(AY)& \text{ Substitute in A}\\ &= A \, \text{VAR}(Y)\, A^T & \text{ Rules for Variance}\\ &= A \, \sigma^2I\, A^T = \sigma^2 A\, A^T& \text{ (3.9)}\\ &= \sigma^2 (X^TX)^{-1}X^T \,\, ((X^TX)^{-1}X^T)^T& \text{Replace A}\\ & = \sigma^2 (X^TX)^{-1}X^T \,\,X (X^TX)^{-1} & \text{Transpose} \\ & = \sigma^2 (X^TX)^{-1}(X^TX) \,\,(X^TX)^{-1} & \text{Add Parens} \\ & = \sigma^2 I (X^TX)^{-1} & \text{Rules for Inverse matrix} \end{align} \]

or, in summary,

\[ \text{VAR}(\hat{\vec{\beta}}) = \sigma^2 (X^TX)^{-1} \tag{3.10}\]

Since \(\sigma^2\) is unknown, we estimate it by \(s^2\).

Given Equation 3.4, we have

\[ s^2 = \widehat{E}(\hat{y}_i - y_i)^2 = \frac{1}{n}\sum(\hat{y}_i - y_i)^2 = \text{ Training MSE} = \frac{SS_{Err}}{n-(p+1)}. \]

Therefore ,for non-singular \(X^TX\),

\[ \widehat{\text{VAR}}(\hat{\vec{\beta}}) = s^2 (X^TX)^{-1} = \text{Training MSE}\times (X^TX)^{-1}. \tag{3.11}\]

3.4 Example with Auto Data

Let’s create a multiple regression model with the Auto Data and examine the results using summary().

Consider mpg as the outcome with four predictor variables.

Show code
suppressMessages(library(ISLR2))
data(Auto)
nrow(Auto)
[1] 392
Show code
reg <- lm(mpg ~  weight + cylinders +
            displacement + acceleration,
          data = Auto)
summary(reg)

Call:
lm(formula = mpg ~ weight + cylinders + displacement + acceleration, 
    data = Auto)

Residuals:
     Min       1Q   Median       3Q      Max 
-11.8112  -2.6937  -0.3254   2.3552  16.2667 

Coefficients:
               Estimate Std. Error t value Pr(>|t|)    
(Intercept)  41.6117231  2.0641673  20.159  < 2e-16 ***
weight       -0.0061308  0.0007451  -8.228 2.93e-15 ***
cylinders    -0.2840434  0.4117492  -0.690   0.4907    
displacement -0.0065319  0.0088275  -0.740   0.4598    
acceleration  0.1874544  0.0980568   1.912   0.0567 .  
---
Signif. codes:  0 '***' 0.001 '**' 0.01 '*' 0.05 '.' 0.1 ' ' 1

Residual standard error: 4.282 on 387 degrees of freedom
Multiple R-squared:  0.7021,    Adjusted R-squared:  0.699 
F-statistic:   228 on 4 and 387 DF,  p-value: < 2.2e-16

3.4.1 The Top of the Summary is about the Parameters

  • the Estimate is the \(\hat{\beta}_k\) for each parameter. This is the average increase in the response variable associated with a one unit increase in the predictor variable, assuming all other predictor variables are held constant.
  • the Std. Error is the square root of the estimated variance for the parameter.
  • the \(t\) value is the ratio of \(\frac{Estimat.e}{Std. Error}\)
  • \(Pr >|t|\) is the result from checking the \(t\) distribution with the degrees of freedom \(n-(p+1)\). Here that means df = \(392 - (4 + 1) = 387\) since there are four variables plus the slope parameter.
    • Which parameters are important or “significant”?

Other functions such as coef() or confint() extract just the estimates or confidence intervals for the parameters.

What happens if you force the model to not have an Intercept parameter?

Show code
reg2 <- lm(mpg ~  weight + cylinders +
            displacement + acceleration -1,
          data = Auto)
summary(reg2)

Call:
lm(formula = mpg ~ weight + cylinders + displacement + acceleration - 
    1, data = Auto)

Residuals:
     Min       1Q   Median       3Q      Max 
-15.8380  -3.5932   0.0494   4.4070  20.0263 

Coefficients:
              Estimate Std. Error t value Pr(>|t|)    
weight       -0.002464   0.001033  -2.385   0.0175 *  
cylinders     3.263122   0.532318   6.130 2.16e-09 ***
displacement -0.061329   0.012010  -5.107 5.15e-07 ***
acceleration  1.569667   0.100240  15.659  < 2e-16 ***
---
Signif. codes:  0 '***' 0.001 '**' 0.01 '*' 0.05 '.' 0.1 ' ' 1

Residual standard error: 6.123 on 388 degrees of freedom
Multiple R-squared:  0.9392,    Adjusted R-squared:  0.9386 
F-statistic:  1499 on 4 and 388 DF,  p-value: < 2.2e-16

Let’s look at some Added Variable Plots (aka Partial Regression Plots)

An Added variable plot displays the relationship between the response variable and one predictor variable while controlling for the presence of other predictor variables in the model.

We can see graphically the switch of multiple variables from not significant to significant

Show code
car::avPlots(reg)
car::avPlots(reg2)

What is going on? Why did the R-Squared go up yet the Residual standard error also went up?

3.4.2 The Bottom of the Summary is about the Overall Model.

  • Residual standard error: The average distance observed values are from the regression line. Smaller is better.
  • Multiple R-Squared: (aka the coefficient of determination). This is the proportion of the variance in the \(Y\) that can be explained by the predictors.
  • Adjusted R-squared: A version of R-squared based on a penalty for the number of predictors. Useful for comparing models with different numbers of variables.
  • F-statistic: The ratio of \(MSR/MSE = \frac{SSR/p}{SSE/(n-(p+1)}\).
    • Use this to test the value of the overall model based on a Null hypothesis of all \(\beta_k=0\), i.e., is there at least one variable with a \(\beta_k\neq 0\).

    • Note \(SSR\) is the sum of the squared difference between the \(\hat{y}_i\) and \(\bar{y}\) or \(SSR= \sum(\hat{y}_i - \bar{y})^2\).

  • \(p\)-value: This is the p-value for the F-statistic with df of \(p\) and \(n-(p+1)\).

3.4.3 The {broom} Package Returns Results as a Data Frame

broom::tidy()gives parameter-level information in a tibble.

Show code
broom::tidy(reg, conf.int = TRUE)
# A tibble: 5 × 7
  term         estimate std.error statistic  p.value conf.low conf.high
  <chr>           <dbl>     <dbl>     <dbl>    <dbl>    <dbl>     <dbl>
1 (Intercept)  41.6      2.06        20.2   2.65e-62 37.6      45.7    
2 weight       -0.00613  0.000745    -8.23  2.93e-15 -0.00760  -0.00467
3 cylinders    -0.284    0.412       -0.690 4.91e- 1 -1.09      0.526  
4 displacement -0.00653  0.00883     -0.740 4.60e- 1 -0.0239    0.0108 
5 acceleration  0.187    0.0981       1.91  5.67e- 2 -0.00534   0.380  

broom::glance() gives model-level information in a tibble. See ?broom::glance.lm

Show code
broom::glance(reg)
# A tibble: 1 × 12
  r.squared adj.r.squared sigma statistic   p.value    df logLik   AIC   BIC
      <dbl>         <dbl> <dbl>     <dbl>     <dbl> <dbl>  <dbl> <dbl> <dbl>
1     0.702         0.699  4.28      228. 2.33e-100     4 -1124. 2260. 2283.
# ℹ 3 more variables: deviance <dbl>, df.residual <int>, nobs <int>
  • Values such as AIC and BIC can be useful for comparing models.

You should also look at plots of the model to assess the original assumptions of Normality of errors and homoscedasticity.

Show code
plot(reg)

This is an example of interpreting the results from R stats::lm() to check if a continuous variable is significant in the model.

3.5 Regression Model in Matrix Form

STAT 415/615 covers the Matrix Form of the Linear Regression Model

Given a model of the form

\[ \vec{Y}_{n\times 1} = \bf{X}_{n \times (p + 1)}\vec{\beta}_{(p+1) \times 1} + \vec{\epsilon}_{n \times 1} \]

this is equivalent to the matrix form:

\[ \underbrace{\begin{pmatrix} y_1 \\ y_2\\ \vdots\\ y_n \end{pmatrix}}_\text{Responses} = \underbrace{\begin{pmatrix} 1 & X_{11} & X_{12} & \cdots & X_{1 p} \\ 1 & X_{21} & X_{22} & \cdots & X_{2 p} \\ 1 & X_{31} & X_{32} & \cdots & X_{3 p} \\ \vdots & \vdots & \vdots & \ddots & \vdots \\ 1 & X_{n1} & X_{n2} & \cdots & X_{np} \\ \end{pmatrix}}_\text{Design Matrix} \underbrace{\begin{pmatrix} \beta_0\\ \beta_1\\ \beta_2\\ \vdots\\ \beta_{p} \end{pmatrix}}_\text{Intercept Slopes} + \underbrace{ \begin{pmatrix} \epsilon_1\\ \epsilon_2\\ \epsilon_3\\ \vdots\\ \epsilon_n\end{pmatrix}}_\text{Errors} \tag{3.12}\]

where it is assumed \(\epsilon_i \sim i.i.d.\ N(0,\sigma^2)\).

There are actually four main assumptions for linear regression.

3.5.1 The Four “LINE” Assumptions for Multiple Linear Regression

  1. Linearity: The response and predictor variables have a linear relationship.
  2. Independence: the predictor variables are independent of each other — no multicollinearity.
  3. Normal: The residuals have a Normal distribution with mean 0 and equal variance for all values of \(X\).
  4. Uncorrelated Errors: The residuals are uncorrelated with each other.

We don’t need these assumptions to minimize the sum of least squares where \(\beta = (X^TX)^{-1}X^TY\). That just requires some calculus to get an answer.

However, the LINE assumptions are needed for testing the Null hypothesis \(H_0: \beta_j = 0 \implies X_j\) is not significant for predicting the response.

If a \(\beta_j = 0\), then all the values in the \(j^{th}\) column of the design matrix are multiplied by 0 so do not contribute to the value of \(\hat{y}\).

Section 3.3.1 discusses using the \(t\)-test for the significance of a single variable by using a \(t\)-statistics defined by Equation 3.7. The assumptions are necessary to establish that the distribution of the \(t\)-statistic is the \(t\) distribution with \(df = n-(p+1)\) (“Student’s t-Distribution” 2022).

3.6 The \(F\)-Test of Significance for Multiple Variables

We also use the LINE assumptions to support the \(F\)-test which allows us to test multiple variables for significance at once.

As an example, in experimental design, one typically tests a group of interactions for significance, not just each one individually.

The \(F\)-test is for a Null hypothesis about a set of slopes such that each slope is zero (so the variables are not significant) versus an Alternative hypothesis that at least one slope is non-zero.

\[ H_0: \begin{cases} \beta_{j=1} = 0\\ \beta_{j=2} = 0\\ \vdots \\\beta_{j=k} = 0 \end{cases} \qquad \text{vs} \qquad H_A: \text{At least one or more slopes }\beta_{j=m}\neq 0 \tag{3.13}\]

The \(t\)-test will not work for more than one slope at a time. You have to use an \(F\)-test.

3.6.1 The \(F\)-test Compares the Variances of Two Models

  • Suppose the Null hypothesis is true and all slopes are 0. This is called a Reduced Model as it has fewer parameters being fitted.
  • The model for the alternative hypothesis where the slopes are not 0 is called a Full Model because all of the variables of interest are being fitted.

Thus Equation 3.13 becomes a test of comparing the variances of the Full and Reduced Models

  • The Full Model uses all predictors \(X_1, \ldots, X_p\) and uses the sample values to estimate their \(\beta\)s.
  • The Reduced Model, under the Null hypothesis with just \(\beta_0\) (the sample mean), does not consider any predictors or the sample values \(X_{j1}, X_{j2}, \ldots, X_{jn}\)

3.6.2 The \(F\)-test uses a Breakout of the Total Sum of Squares.

\[ SS_{Total} = \sum(y_i - \bar{y})^2 \]

Total Sum of Squares

The Total Sum of Squares is a function of only the sample data without regard to any particular model.

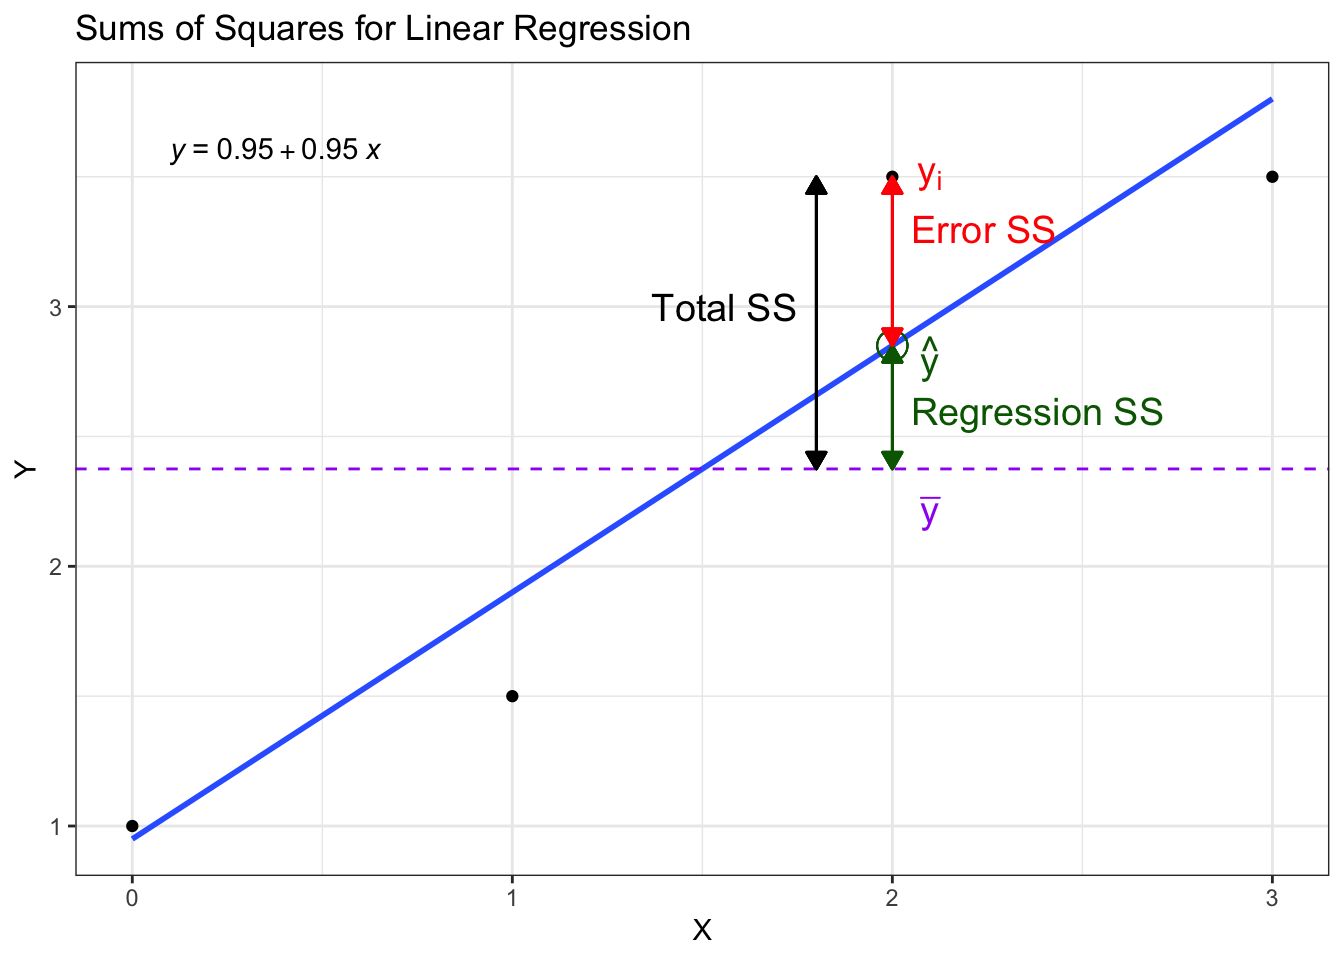
The Total Sum of Squares captures all of the variation in the data and can be broken into two parts when there is a fitted model.

\[ SS_{Total} = SS_{Regression} + SS_{Error} \]

\[ \begin{align}SS_{Regression} &= \text{how much total variation is explained by the model}\\ SS_{Error} &= \text{how much total variation is not explained by the model} \end{align} \]

For simple linear regression, the Sum of Squares breakout looks like the following example where the totals are summed across all \(y_i\).

Show code
df <- tribble(
  ~X, ~Y,
  0,   1,
  1,   1.5,
  2,   3.5,
  3,   3.5
)

ggplot(df, aes(x = X, y = Y)) +
  geom_point() +
  geom_smooth(method = lm, se = FALSE) +
  ggpubr::stat_regline_equation(label.x = .1, label.y = 3.6, 
                                aes(label = ..eq.label..)) +
  geom_point(aes(x = 2, y = .95 + 1.9), color = "darkgreen", 
             pch = 1,size = 5) +
  theme_bw() +
  geom_hline(yintercept = mean(df$Y), color = "purple", lty = 2) +
  annotate("text", x = 2.1, y = 2.8, label = latex2exp::TeX("$\\hat{y}$"),
           size = 5, color = "darkgreen") +
  annotate("text", x = 2.1, y = 2.2, label = latex2exp::TeX("$\\bar{y}$"),
           size = 5, color = "purple") +
  annotate("text", x = 2.1, y = 3.5, label = latex2exp::TeX("$y_i$"),
           size = 5, color = "red") +
  geom_segment(aes(x = 1.8, y = mean(df$Y), xend = 1.8, yend = 3.5),
               arrow = arrow(ends = "both", type = "closed",
                             length = unit(.1, "inches")),
               color = "black") +
  annotate("text", x = 1.75, y = 3, label = "Total SS",
           size = 5, color = "black", hjust = 1) +
  geom_segment(aes(x = 2, y = mean(df$Y), xend = 2, yend = 2.85),
               arrow = arrow(ends = "both", type = "closed",
                             length = unit(.1, "inches")),
               color = "darkgreen") +
  annotate("text", x = 2.05, y = 2.6, label = "Regression SS",
           size = 5, color = "darkgreen", hjust = 0) +
  geom_segment(aes(x = 2, y = 2.85,  xend = 2, yend = 3.5),
               arrow = arrow(ends = "both", type = "closed", 
                             length = unit(.1, "inches")),
               color = "red") +
  annotate("text", x = 2.05, y = 3.3, label = "Error SS",
           size = 5, color = "red", hjust = 0) +
  labs(title = "Sums of Squares for Linear Regression")
Figure 3.1: Sum of Squares Breakout
A More General Reduced Model

In a more general setting, a Reduced Model may have one or more predictor variables being fit, just not all - which would make it a Full Model.

One can generate multiple reduced models, with different parameters, and compare them.

3.6.3 Breakout of Total Sum of Squares Across Reduced and Full Models

Let’s start by breaking out the Sum of Squares for the Reduced model.

\[ \begin{align} & SS_{Total} \\ \swarrow & \searrow \\ \underbrace{SS_{Reg}^{Red}}_\text{Explained Variation: Reduced} & \quad \underbrace{SS_{Error}^{Red}}_\text{Unexplained Variation: Reduced} \\ \end{align} \tag{3.14}\]

The reduced model in Equation 3.14 may have one or more variables in the model so the \(SS_{Reg}^{Red}\) represents the variability that is explained by the variables remaining in the reduced model.

Like-wise the \(SS_{Err}^{Red}\) represents the variability that is not explained by the variables remaining in the reduced model. That variability could be explained by adding additional variables into the reduced model up to including all of the other variables which would make it a Full model.

\[ \begin{align} & SS_{Total} \\ \swarrow & \searrow \\ \underbrace{SS_{Reg}^{Red}}_\text{Explained Variation: Reduced} & \quad \underbrace{SS_{Error}^{Red}}_\text{Unexplained Variation: Reduced} \\ &\qquad \qquad \quad\quad\swarrow \searrow \\ &\qquad \qquad?? \underbrace{SS_{Error}^{Full}}_\text{Unexplained Variation: Full} \end{align} \tag{3.15}\]

By adding in the additional variables, we are essentially conducting a regression on the residuals in Equation 3.14 so that allows us to breakout the \(SS_{Error}^{Red}\) as we see in Equation 3.15.

Since Sums of Squares are always positive, this allows us to conclude

\[ \begin{align} &SS_{Error}^{Full} & \leq \qquad SS_{Error}^{Red}\\ \qquad\\ + \qquad &SS_{Reg}^{Full} & \geq \qquad SS_{Reg}^{Red}\\ \hline &SS_{Total} & = \qquad SS_{Total} \end{align} \tag{3.16}\]

So, what is the ?? in Equation 3.15?

From Equation 3.16, we can see that ?? is the difference in the variation explained in the Full model compared to the Reduced model or \(SS_{Reg}^{Full}\ -SS_{Reg}^{Red}\). This is the contribution of the additional variables in the Full compared to the Reduced model.

There is a special term for this difference and that is the Extra Sum of Squares for the full model (aka the Sequential Sum of Squares).

\[ \begin{align} & SS_{Total} \\ \swarrow & \searrow \\ \underbrace{SS_{Reg}^{Red}}_\text{Explained Variation: Reduced} & \quad \underbrace{SS_{Error}^{Red}}_\text{Unexplained Variation: Reduced} \\ &\qquad \qquad \quad\quad\swarrow \searrow \\ &\underbrace{SS_{Extra}^{Full}}_\text{Extra Explained Variation: Full} \quad \underbrace{SS_{Error}^{Full}}_\text{Unexplained Variation: Full} \end{align} \tag{3.17}\]

It is this Extra Sum of Squares we want to test to see if it was worth it to add the additional variables to the Reduced Model.

3.6.4 Consider Degrees of Freedom for Full and Reduced Models

Assume there are \(p-k\) variables in the Reduced Model where \(k\leq p\).

Then we can also break out the degrees of freedom for each of the Sums of Squares as follows

\[ \begin{align} & SS_{Total} & \text{total }df = n-1\\ \swarrow & \searrow \\ \underbrace{SS_{Reg}^{Red}}_{df = p-k} & \quad \underbrace{SS_{Error}^{Red}}_\text{df = n - (p +1) + k } & \text{total }df = n-1\\ &\qquad \swarrow \searrow \\ &\underbrace{SS_{Extra}^{Full}}_{df = k } \quad \underbrace{SS_{Error}^{Full}}_{df = n-(p+1)}& \text{total }df = n-1 \end{align} \tag{3.18}\]

3.6.5 Building the F Statistic

Looking at the bottom of Equation 3.18, the \(SS_{Extra}^{Full}\) and \(SS_{Error}^{Full}\) are uncorrelated.

An example: testing for side effects in a new vaccine.

  • Assume \(H_0\): there are no side effects.
  • You calculate the Extra Sum of Squares for the side effect variables and it’s 65.
  • Is 65 big enough to reject \(H_0\) or is 65 so small there is insufficient evidence to reject \(H_0\)?
  • Without a baseline for comparison, we don’t know!

The \(F\)-test uses the following ratio to calculate an \(F\)-statistic for which the distribution in known (based on the LINE assumptions).

\[ F = \frac{SS_{Extra}/df_{Ex}} {SS_{Err}^{Full}/df_{Full}} = \frac{SS_{Extra}/k} {SS_{Err}^{Full}/(n-(p+1))} \tag{3.19}\]

which then gets compared to probability density function for the \(F\)-distribution with \(k, n-(P+1)\) degrees of freedom.

This is always a Right-Tailed Test.

We only reject \(H_0\) for large values of \(F\).

Show code
set.seed(123)
n <- 1000
k <- 5
p <- 10
df <- tibble(F = rf(n, k, n - (p + 1)))
pp <- ggplot(df, aes(F)) + 
  geom_density() + 
  geom_vline(xintercept = qf(.95, k, n - (p + 1)),
             lty = 2, color = "red")
d <- ggplot_build(pp)$data[[1]]
pp +
  geom_area(data = subset(d, x > qf(.95, k, n - (p + 1))),
            aes(x = x, y = y), fill = "red") +
labs(title = "F = .95 Quantile for a Sampled F-Distribution with 5, 989 df" ) +
annotate("text", x = .1 +qf(.95, k, n - (p + 1)), 
         y = .3, 
         label = paste("F = ",(qf(.95, k, n - (p + 1)))),
           size = 5, color = "black", hjust = 0) +
annotate("text", x = 2.5, 
         y = .15, 
         label = "Area under the curve \nis the p-value",
           size = 5, color = "red", hjust = 0) 

\(F\) can also be defined as the ratio of two independent \(\chi^2\) variables.

We have two cases

  1. \(SS_{Extra}/k\) is relatively large, so \(F\) is large (to the right of the density function), which means \(p\) is small, so evidence to reject \(H_0\) and the additional variables are significant.

  2. \(SS_{Extra}/k\) is relatively small, so \(F\) is small (to the left of the density function), which means \(p\) is large, so little evidence to reject \(H_0\) and the additional variables are not significant.

3.7 Example using R

Let’s look at the Auto data and build a Full model with five variables. Note we will keep cylinders as numeric.

Show code
library(ISLR2)
data(Auto)
glimpse(Auto)
Rows: 392
Columns: 9
$ mpg          <dbl> 18, 15, 18, 16, 17, 15, 14, 14, 14, 15, 15, 14, 15, 14, 2…
$ cylinders    <int> 8, 8, 8, 8, 8, 8, 8, 8, 8, 8, 8, 8, 8, 8, 4, 6, 6, 6, 4, …
$ displacement <dbl> 307, 350, 318, 304, 302, 429, 454, 440, 455, 390, 383, 34…
$ horsepower   <int> 130, 165, 150, 150, 140, 198, 220, 215, 225, 190, 170, 16…
$ weight       <int> 3504, 3693, 3436, 3433, 3449, 4341, 4354, 4312, 4425, 385…
$ acceleration <dbl> 12.0, 11.5, 11.0, 12.0, 10.5, 10.0, 9.0, 8.5, 10.0, 8.5, …
$ year         <int> 70, 70, 70, 70, 70, 70, 70, 70, 70, 70, 70, 70, 70, 70, 7…
$ origin       <int> 1, 1, 1, 1, 1, 1, 1, 1, 1, 1, 1, 1, 1, 1, 3, 1, 1, 1, 3, …
$ name         <fct> chevrolet chevelle malibu, buick skylark 320, plymouth sa…

We have a model with \(p = 5\).

Show code
full <- lm(mpg ~ weight + acceleration + cylinders + horsepower + year, data = Auto)
summary(full)

Call:
lm(formula = mpg ~ weight + acceleration + cylinders + horsepower + 
    year, data = Auto)

Residuals:
    Min      1Q  Median      3Q     Max 
-8.7973 -2.3663 -0.0524  1.9950 14.3169 

Coefficients:
               Estimate Std. Error t value Pr(>|t|)    
(Intercept)  -1.510e+01  4.734e+00  -3.189  0.00154 ** 
weight       -6.486e-03  6.015e-04 -10.784  < 2e-16 ***
acceleration  7.346e-02  1.014e-01   0.724  0.46928    
cylinders    -9.763e-02  2.466e-01  -0.396  0.69233    
horsepower    3.038e-03  1.344e-02   0.226  0.82129    
year          7.493e-01  5.248e-02  14.278  < 2e-16 ***
---
Signif. codes:  0 '***' 0.001 '**' 0.01 '*' 0.05 '.' 0.1 ' ' 1

Residual standard error: 3.436 on 386 degrees of freedom
Multiple R-squared:  0.8087,    Adjusted R-squared:  0.8062 
F-statistic: 326.4 on 5 and 386 DF,  p-value: < 2.2e-16

Looking at the summary(), we can look at the PR>|t|) and see that weight has substantial evidence to reject that it is 0, even in the presence of several other variables.

  • The estimate is \(\hat{\beta}_j\), the Std. Error comes from the square root of the diagonal of the variance-covariance matrix, and their ratio gives the t value or \(t\)-statistic.
  • With \(n = 392\), the \(t\)- distribution has \(df = 392 - (5 + 1) = 386\).
  • It’s a two sided \(p-\) value so you can compute with the pt() function for the probability distribution function for the \(t\) distribution and then multiply by 2.
Show code
pt(-10.784, 386)*2
[1] 7.059491e-24
  • acceleration does not seem to be significant.
Show code
pt(0.724, 386, lower.tail = FALSE)*2
[1] 0.4695043
Show code
pt(-abs(0.724), 386, lower.tail = TRUE)*2 # t-dist is symmetric
[1] 0.4695043
Note

R probability distribution functions return \(P[X\leq x]\) with the argument lower.tail = TRUE as the default.

3.7.1 Compare Full vs Reduced using a Partial F-Test

Let’s compare the Full to a reduced model without acceleration().

Show code
reduced <- lm(mpg ~ weight  + cylinders + horsepower + year, data = Auto)

We are not interested in the summary but in comparing the two models.

We use the stats::anova() function to compare two or more nested models.

  • Note: when given a sequence of objects, anova() tests the models against one another in the order specified in the function call.
Show code
an_out <- anova(reduced, full)
an_out
Analysis of Variance Table

Model 1: mpg ~ weight + cylinders + horsepower + year
Model 2: mpg ~ weight + acceleration + cylinders + horsepower + year
  Res.Df    RSS Df Sum of Sq      F Pr(>F)
1    387 4562.4                           
2    386 4556.2  1    6.1934 0.5247 0.4693
  • The Reduced has one more degree of freedom.
  • The Reduced has a larger Error sum of squares (SSE) but is it large enough?
  • The Df is the number of Extra parameters, here 1 for acceleration.
  • The Sum of Sq gives us the difference between the two - the Extra Sum of squares 6.2.
Show code
pf(0.5247021, 1, 386, lower.tail = FALSE)
[1] 0.4692816
  • If you take the \(t\)-statistic from the Full model summary for acceleration (0.724), and square it, you get 0.524176 which is the value of the \(f\)-statistic. Why?

    • We are only testing one additional variable in our Full model.

Is a \(p\)-value of .46 high or low? Should we reject the Null hypothesis?

  • If the Null hypothesis is true, then the \(p\)-value has a uniform distribution.

  • That means an \(F\)-statistic of 0.5247, and its corresponding \(p\)-value of .46, could be expected about half of the time given the data set so not a rare event.

  • Insufficient evidence to reject the Null in this case.

  • Many organizations are used to using a rejection level of .05 or 5% for historical reasons but there is nothing magical about it. It is one piece of information about your model.

  • Most practical \(\alpha\), in many domains, are between 1% and 10%.

  • Always report your \(p\)-value within the context of the data, the assumptions about the model, the risk of a wrong decisions as well as confidence intervals and effect sizes.

3.7.2 A Reduced Model with More than One Removed Variables

Show code
reduced2 <-  lm(mpg ~ weight + cylinders, data = Auto)
anova(reduced2, full)
Analysis of Variance Table

Model 1: mpg ~ weight + cylinders
Model 2: mpg ~ weight + acceleration + cylinders + horsepower + year
  Res.Df    RSS Df Sum of Sq      F    Pr(>F)    
1    389 7206.1                                  
2    386 4556.2  3    2649.9 74.833 < 2.2e-16 ***
---
Signif. codes:  0 '***' 0.001 '**' 0.01 '*' 0.05 '.' 0.1 ' ' 1
  • We now have Extra sum of squares with 3 variables.
  • The Sum of Sq is large and the \(F\)-statistic is large so the \(p\)_value is quite small.

What is the Null Hypothesis? \(H_0\): All three \(\beta_{j=1, 2, 3} = 0\).

How do we interpret the result? - At least one of the \(\beta_j \neq 0\) but we don’t know which one.

3.7.3 Categorical Predictors

Show code
summary(Auto)
      mpg          cylinders      displacement     horsepower        weight    
 Min.   : 9.00   Min.   :3.000   Min.   : 68.0   Min.   : 46.0   Min.   :1613  
 1st Qu.:17.00   1st Qu.:4.000   1st Qu.:105.0   1st Qu.: 75.0   1st Qu.:2225  
 Median :22.75   Median :4.000   Median :151.0   Median : 93.5   Median :2804  
 Mean   :23.45   Mean   :5.472   Mean   :194.4   Mean   :104.5   Mean   :2978  
 3rd Qu.:29.00   3rd Qu.:8.000   3rd Qu.:275.8   3rd Qu.:126.0   3rd Qu.:3615  
 Max.   :46.60   Max.   :8.000   Max.   :455.0   Max.   :230.0   Max.   :5140  
                                                                               
  acceleration        year           origin                      name    
 Min.   : 8.00   Min.   :70.00   Min.   :1.000   amc matador       :  5  
 1st Qu.:13.78   1st Qu.:73.00   1st Qu.:1.000   ford pinto        :  5  
 Median :15.50   Median :76.00   Median :1.000   toyota corolla    :  5  
 Mean   :15.54   Mean   :75.98   Mean   :1.577   amc gremlin       :  4  
 3rd Qu.:17.02   3rd Qu.:79.00   3rd Qu.:2.000   amc hornet        :  4  
 Max.   :24.80   Max.   :82.00   Max.   :3.000   chevrolet chevette:  4  
                                                 (Other)           :365  

Look at the help for the data set to see what the variables mean.

Show code
?Auto

Note that origin should really be a factor or categorical variable. We could consider cylinders as well.

Let’s create a new Full model by adding origin.

Show code
full <- lm(mpg ~ weight + acceleration + cylinders + horsepower + year +
             origin, data = Auto)
summary(full)

Call:
lm(formula = mpg ~ weight + acceleration + cylinders + horsepower + 
    year + origin, data = Auto)

Residuals:
   Min     1Q Median     3Q    Max 
-9.687 -2.144 -0.090  1.720 13.171 

Coefficients:
               Estimate Std. Error t value Pr(>|t|)    
(Intercept)  -1.809e+01  4.669e+00  -3.875 0.000125 ***
weight       -5.808e-03  6.063e-04  -9.580  < 2e-16 ***
acceleration  5.382e-02  9.909e-02   0.543 0.587350    
cylinders     7.463e-02  2.437e-01   0.306 0.759602    
horsepower   -6.247e-03  1.328e-02  -0.470 0.638435    
year          7.418e-01  5.125e-02  14.472  < 2e-16 ***
origin        1.193e+00  2.658e-01   4.487 9.57e-06 ***
---
Signif. codes:  0 '***' 0.001 '**' 0.01 '*' 0.05 '.' 0.1 ' ' 1

Residual standard error: 3.354 on 385 degrees of freedom
Multiple R-squared:  0.8182,    Adjusted R-squared:  0.8154 
F-statistic: 288.8 on 6 and 385 DF,  p-value: < 2.2e-16

With origin as a number, it is treated as continuous and we get a single slope for it.

Let’s try with origin as a factor (aka categorical predictor) variable.

Show code
full <- lm(mpg ~ weight + acceleration + cylinders + horsepower + year +
             as.factor(origin), data = Auto)
summary(full)

Call:
lm(formula = mpg ~ weight + acceleration + cylinders + horsepower + 
    year + as.factor(origin), data = Auto)

Residuals:
    Min      1Q  Median      3Q     Max 
-9.2846 -2.1094  0.0135  1.8127 13.4034 

Coefficients:
                     Estimate Std. Error t value Pr(>|t|)    
(Intercept)        -1.861e+01  4.726e+00  -3.939 9.71e-05 ***
weight             -5.880e-03  6.059e-04  -9.704  < 2e-16 ***
acceleration        4.882e-02  9.886e-02   0.494 0.621702    
cylinders           1.610e-01  2.479e-01   0.649 0.516474    
horsepower         -5.554e-03  1.325e-02  -0.419 0.675378    
year                7.593e-01  5.206e-02  14.585  < 2e-16 ***
as.factor(origin)2  2.023e+00  5.383e-01   3.758 0.000198 ***
as.factor(origin)3  2.317e+00  5.316e-01   4.359 1.68e-05 ***
---
Signif. codes:  0 '***' 0.001 '**' 0.01 '*' 0.05 '.' 0.1 ' ' 1

Residual standard error: 3.344 on 384 degrees of freedom
Multiple R-squared:  0.8197,    Adjusted R-squared:  0.8164 
F-statistic: 249.4 on 7 and 384 DF,  p-value: < 2.2e-16

Now we see two estimates – this is because we have three levels in our factor so R created two dummy variables and estimated their “slope” parameters.

Let’s see what these estimates mean.

3.8 Dummy Variables and Interactions

Dummy Variables are a technique for including categorical predictors with multiple levels in a model.

Assume we have a categorical predictor \(X\) with \(k\) levels.

Create \((k-1)\) Dummy variables \(Z_1, \ldots Z_{k-1}\) where

\[ Z_j = \cases{ 1 \text{ if level }j \\ 0 \text{ otherwise} } \]

If all \(Z_j = 0 \implies \text{it's the last remaining level}\).

We can write our model as

\[ Y = \beta_0 + \beta_1X_1 + \cdots + \gamma_1 Z_{1} + \cdots + \gamma_{k-1} Z_{k-1} + \epsilon \]

We have defined

\[ \beta_1 = \text{Expected } \Delta Y \text{when } \Delta X_j = 1 \text{ increment and } \Delta X_{i \neq j} = 0 \]

Let’s define

\[ \gamma = \text{Expected } \Delta Y \text{ when the level changes from } k \text{ to }1 \tag{3.20}\]

So the Null hypotheses for \(\gamma_i\) is

\[ H_0: \gamma_i = 0 \implies \text{ there is no difference between level } i \text{ and the baseline level }k. \]

3.8.1 Interactions

Two predictors interact if the effect on the response variable \(Y\) of predictor \(X_i\) depends on the value of predictor \(X_j\).

We consider interactions as a “product” between the two (or more) variables.

To represent an interaction between a continuous and a categorical variable, write the model as

\[ Y = \beta_0 + \beta_1 X_1 + \gamma_1 Z_1 + \underbrace{\delta_1 X_1Z_1}_{\text{Interaction term}} + \epsilon \tag{3.21}\]

So, if there is no interaction (\(\delta_i=0\)), then we can interpret the value of \(\gamma_j\) as a change in the intercept of the regression line – the slopes do not change.

Let’s look at two cases for a Dummy Variable using Equation 3.21.

\[ \begin{align} Z_1 = 0 \implies EY &= \beta_0 + \beta_1X_1\\ Z_1 = 1 \implies EY &= \beta_0 + \beta_1X_1 + \gamma_1 +\delta_1 X_1\\ &= \underbrace{(\beta_0 + \gamma_1)}_{\text{New Intercept}} + \underbrace{(\beta_1 + \delta_1)}_{\text{New Slope}}X_1 \end{align} \]

We can interpret this as a change in both Intercept and Slope when the level of a categorical variable changes from the baseline level \(k\).

3.8.1.1 Categorical Predictor Example with Auto Data

Run the model.

Show code
reg <-  lm(mpg ~ weight + as.factor(origin), data = Auto)
summary(reg)

Call:
lm(formula = mpg ~ weight + as.factor(origin), data = Auto)

Residuals:
     Min       1Q   Median       3Q      Max 
-13.1339  -2.7358  -0.3032   2.4307  15.4544 

Coefficients:
                     Estimate Std. Error t value Pr(>|t|)    
(Intercept)        43.7322362  1.1134286  39.277  < 2e-16 ***
weight             -0.0070271  0.0003201 -21.956  < 2e-16 ***
as.factor(origin)2  0.9709056  0.6587673   1.474 0.141340    
as.factor(origin)3  2.3271499  0.6648043   3.501 0.000518 ***
---
Signif. codes:  0 '***' 0.001 '**' 0.01 '*' 0.05 '.' 0.1 ' ' 1

Residual standard error: 4.277 on 388 degrees of freedom
Multiple R-squared:  0.702, Adjusted R-squared:  0.6997 
F-statistic: 304.7 on 3 and 388 DF,  p-value: < 2.2e-16

What do you notice about the degrees of freedom?

Let’s plot.

Show code
plot(Auto$weight, Auto$mpg)
Yhat <- predict(reg)
points(Auto$weight, Yhat, col = Auto$origin, lwd = 3)

Show code
ggplot(Auto, aes(x = weight, y = mpg)) +
  geom_point() +
  geom_point(aes(x = weight, y = predict(reg), color= as.factor(origin)),
             lwd = 3)

The plot shows three parallel lines with different intercepts.

Let’s include interactions by using * instead of + in the formula.

  • The formula A * B is shorthand for A + B + A:B.
reg <-  lm(mpg ~ weight * as.factor(origin), data = Auto)
summary(reg)

Call:
lm(formula = mpg ~ weight * as.factor(origin), data = Auto)

Residuals:
     Min       1Q   Median       3Q      Max 
-13.4928  -2.7715  -0.3895   2.2397  15.5163 

Coefficients:
                            Estimate Std. Error t value Pr(>|t|)    
(Intercept)                4.315e+01  1.186e+00  36.378  < 2e-16 ***
weight                    -6.854e-03  3.423e-04 -20.020  < 2e-16 ***
as.factor(origin)2         1.125e+00  2.878e+00   0.391  0.69616    
as.factor(origin)3         1.111e+01  3.574e+00   3.109  0.00202 ** 
weight:as.factor(origin)2  3.575e-06  1.111e-03   0.003  0.99743    
weight:as.factor(origin)3 -3.865e-03  1.541e-03  -2.508  0.01255 *  
---
Signif. codes:  0 '***' 0.001 '**' 0.01 '*' 0.05 '.' 0.1 ' ' 1

Residual standard error: 4.253 on 386 degrees of freedom
Multiple R-squared:  0.7068,    Adjusted R-squared:  0.703 
F-statistic: 186.1 on 5 and 386 DF,  p-value: < 2.2e-16
Show code
plot(Auto$weight, Auto$mpg)
Yhat <- predict(reg)
points(Auto$weight, Yhat, col = Auto$origin, lwd = 3)

reg <-  lm(mpg ~ weight * as.factor(origin), data = Auto)
summary(reg)

Call:
lm(formula = mpg ~ weight * as.factor(origin), data = Auto)

Residuals:
     Min       1Q   Median       3Q      Max 
-13.4928  -2.7715  -0.3895   2.2397  15.5163 

Coefficients:
                            Estimate Std. Error t value Pr(>|t|)    
(Intercept)                4.315e+01  1.186e+00  36.378  < 2e-16 ***
weight                    -6.854e-03  3.423e-04 -20.020  < 2e-16 ***
as.factor(origin)2         1.125e+00  2.878e+00   0.391  0.69616    
as.factor(origin)3         1.111e+01  3.574e+00   3.109  0.00202 ** 
weight:as.factor(origin)2  3.575e-06  1.111e-03   0.003  0.99743    
weight:as.factor(origin)3 -3.865e-03  1.541e-03  -2.508  0.01255 *  
---
Signif. codes:  0 '***' 0.001 '**' 0.01 '*' 0.05 '.' 0.1 ' ' 1

Residual standard error: 4.253 on 386 degrees of freedom
Multiple R-squared:  0.7068,    Adjusted R-squared:  0.703 
F-statistic: 186.1 on 5 and 386 DF,  p-value: < 2.2e-16
Show code
reg <-  lm(mpg ~ weight * as.factor(origin), data = Auto)
ggplot(Auto, aes(x = weight, y = mpg)) +
  geom_point() +
  geom_point(aes(x = weight, y = predict(reg), color= as.factor(origin)),
             lwd = 3)

Now we see non-parallel lines. The miles per gallon depends on weight but the way it depends varies with the country of origin. If the interaction is significant then it contributes to the model.

3.8.1.2 Categorical Predictor Example with Palmer Penguins Data

In Section 3.1.0.1 we looked at multiple continuous predictors.

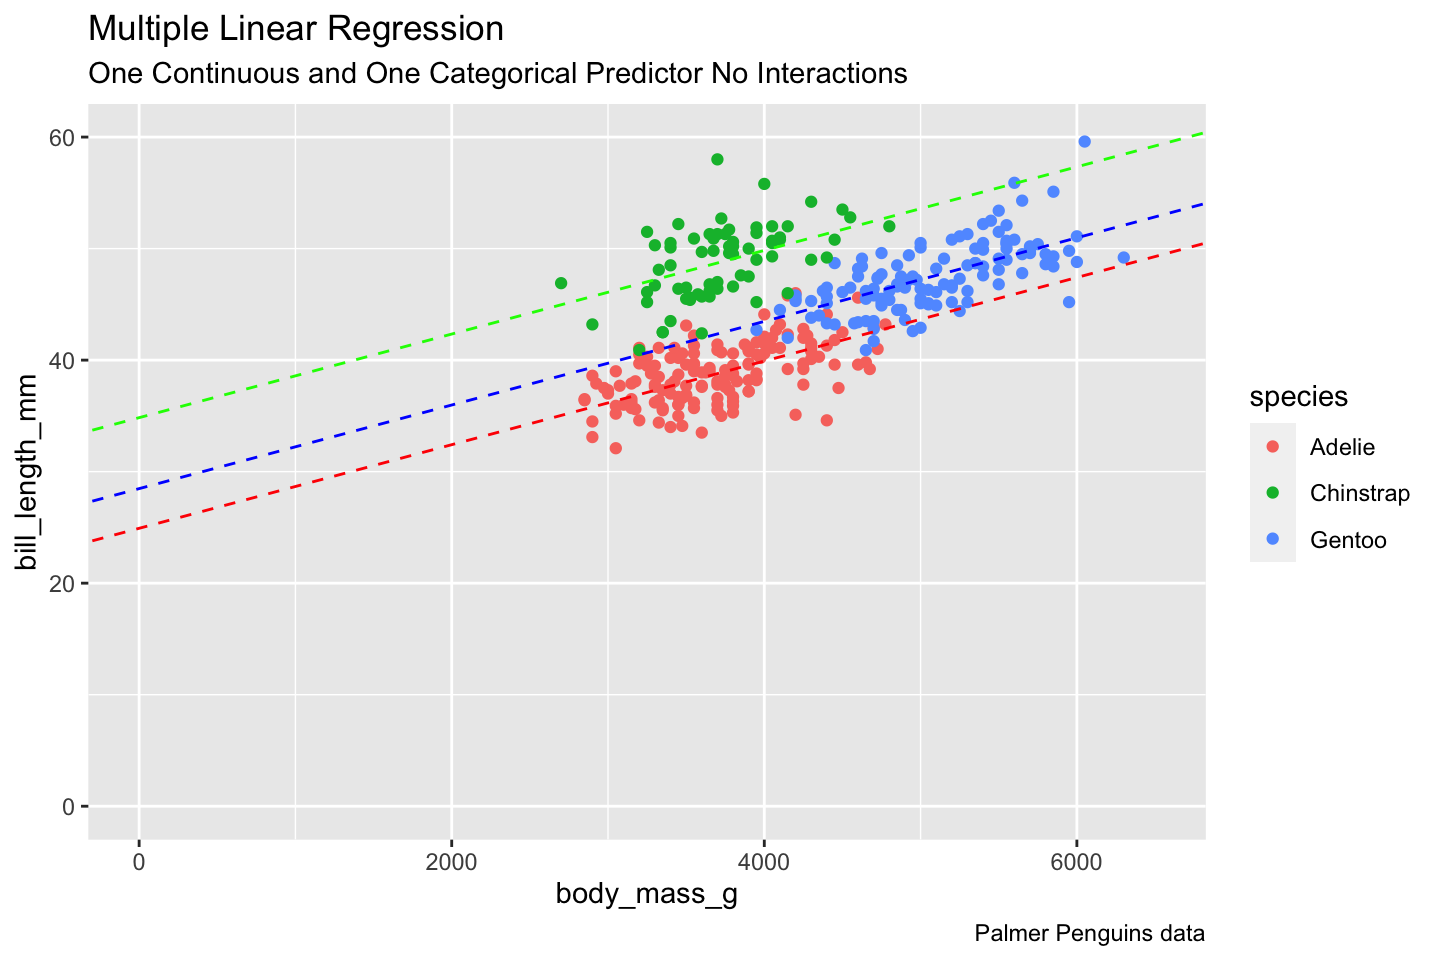
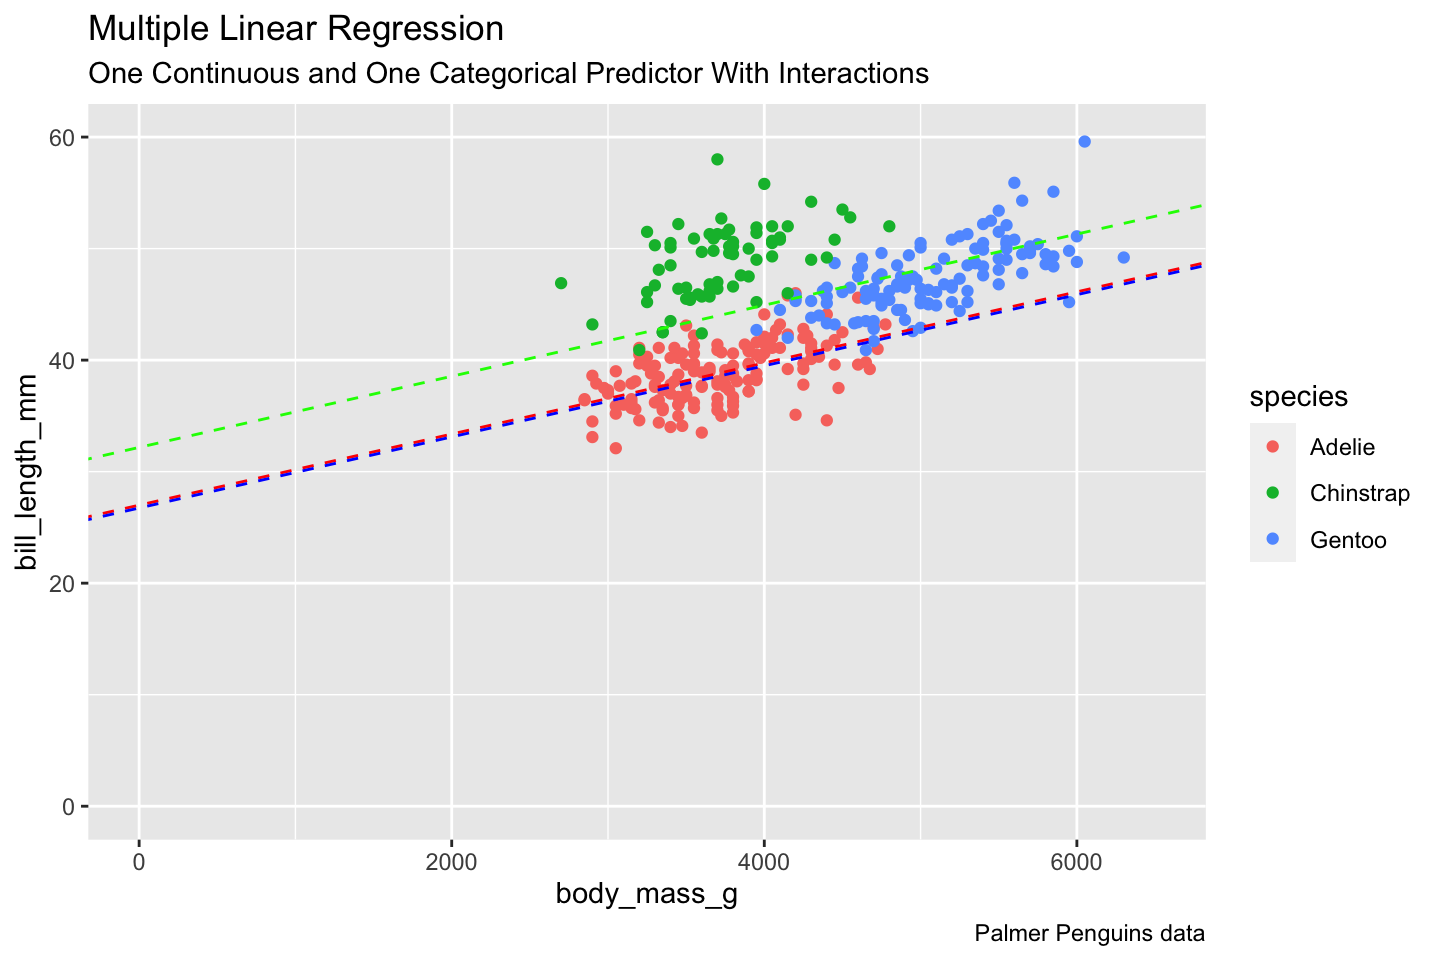
Let’s look at bill_length_mm vs body_mass_g and species where species is categorical.

Show code
library(palmerpenguins)
levels(penguins$species)
[1] "Adelie"    "Chinstrap" "Gentoo"   

Let’s run the model without and without interactions

Show code
lm_out2c <- lm(bill_length_mm ~ body_mass_g + species, data = penguins)
summary(lm_out2c)
lm_out2ci <- lm(bill_length_mm ~ body_mass_g * species, data = penguins)
summary(lm_out2ci)

Call:
lm(formula = bill_length_mm ~ body_mass_g + species, data = penguins)

Residuals:
    Min      1Q  Median      3Q     Max 
-6.8129 -1.6718  0.1336  1.4720  9.2902 

Coefficients:
                  Estimate Std. Error t value Pr(>|t|)    
(Intercept)      2.492e+01  1.063e+00  23.443  < 2e-16 ***
body_mass_g      3.749e-03  2.823e-04  13.276  < 2e-16 ***
speciesChinstrap 9.921e+00  3.511e-01  28.258  < 2e-16 ***
speciesGentoo    3.558e+00  4.858e-01   7.324 1.78e-12 ***
---
Signif. codes:  0 '***' 0.001 '**' 0.01 '*' 0.05 '.' 0.1 ' ' 1

Residual standard error: 2.403 on 338 degrees of freedom
  (2 observations deleted due to missingness)
Multiple R-squared:  0.808, Adjusted R-squared:  0.8063 
F-statistic:   474 on 3 and 338 DF,  p-value: < 2.2e-16

Call:
lm(formula = bill_length_mm ~ body_mass_g * species, data = penguins)

Residuals:
    Min      1Q  Median      3Q     Max 
-6.4208 -1.6461  0.0919  1.4718  9.3138 

Coefficients:
                               Estimate Std. Error t value Pr(>|t|)    
(Intercept)                  26.9941391  1.5926015  16.950  < 2e-16 ***
body_mass_g                   0.0031879  0.0004271   7.464 7.27e-13 ***
speciesChinstrap              5.1800537  3.2746719   1.582    0.115    
speciesGentoo                -0.2545907  2.7138655  -0.094    0.925    
body_mass_g:speciesChinstrap  0.0012748  0.0008740   1.459    0.146    
body_mass_g:speciesGentoo     0.0009030  0.0006066   1.489    0.138    
---
Signif. codes:  0 '***' 0.001 '**' 0.01 '*' 0.05 '.' 0.1 ' ' 1

Residual standard error: 2.399 on 336 degrees of freedom
  (2 observations deleted due to missingness)
Multiple R-squared:  0.8098,    Adjusted R-squared:  0.807 
F-statistic: 286.1 on 5 and 336 DF,  p-value: < 2.2e-16
Dummy Variables in R

R chooses Dummy Variables by the order of the factor variable levels. The first level is the baseline level built into the intercept estimate.

What do you notice about the results? What is going on?

Let’s compare the two models.

Show code
anova(lm_out2c, lm_out2ci)
Analysis of Variance Table

Model 1: bill_length_mm ~ body_mass_g + species
Model 2: bill_length_mm ~ body_mass_g * species
  Res.Df    RSS Df Sum of Sq      F Pr(>F)
1    338 1952.0                           
2    336 1933.4  2    18.596 1.6159 0.2003

Let’s plot.

Show code
ggplot(penguins, aes(x = body_mass_g, y = bill_length_mm,
                     color = species)) +
  geom_point() +
  geom_abline(intercept = lm_out2c$coefficients["(Intercept)"],
              slope = lm_out2c$coefficients[2],
              color = "red",
              lty = 2) +
    geom_abline(intercept = lm_out2c$coefficients["(Intercept)"] + lm_out2c$coefficients["speciesChinstrap"],
              slope = lm_out2c$coefficients[2],
              color = "green",
              lty = 2) +
      geom_abline(intercept = lm_out2c$coefficients["(Intercept)"] + lm_out2c$coefficients["speciesGentoo"],
              slope = lm_out2c$coefficients[2],
              color = "blue",
              lty = 2) +
  coord_cartesian(xlim = c(0, 6500),
                  ylim = c(0, 60)) +
  labs(title = "Multiple Linear Regression",
       subtitle = "One Continuous and One Categorical Predictor No Interactions",
       caption = "Palmer Penguins data")


ggplot(penguins, aes(x = body_mass_g, y = bill_length_mm,
                     color = species)) +
  geom_point() +
  geom_abline(
    intercept = lm_out2ci$coefficients["(Intercept)"],
    slope = lm_out2ci$coefficients[2],
    color = "red",
    lty = 2
  ) +
  geom_abline(
    intercept = lm_out2ci$coefficients["(Intercept)"] +
      lm_out2ci$coefficients["speciesChinstrap"],
    slope = lm_out2ci$coefficients[2],
    color = "green",
    lty = 2
  ) +
  geom_abline(
    intercept = lm_out2ci$coefficients["(Intercept)"] +
      lm_out2ci$coefficients["speciesGentoo"],
    slope = lm_out2ci$coefficients[2],
    color = "blue",
    lty = 2
  ) +
  coord_cartesian(xlim = c(0, 6500),
                  ylim = c(0, 60)) +
  labs(title = "Multiple Linear Regression",
       subtitle = "One Continuous and One Categorical Predictor With Interactions",
       caption = "Palmer Penguins data")
Figure 3.2: No interactions
Figure 3.3: With Interactions

Which model would you recommend and why?

3.8.1.3 Example with Home Sales Data.

Read in the data set HOME_SALES.txt (download from “https://raw.githubusercontent.com/rressler/data_raw_courses/main/HOME_SALES.csv”) and take a look at it.

Show code
home <- read_csv("https://raw.githubusercontent.com/rressler/data_raw_courses/main/HOME_SALES.csv",
                 show_col_types = FALSE)
names(home)
 [1] "ID"              "SALES_PRICE"     "FINISHED_AREA"   "BEDROOMS"       
 [5] "BATHROOMS"       "GARAGE_SIZE"     "YEAR_BUILT"      "STYLE"          
 [9] "LOT_SIZE"        "AIR_CONDITIONER" "POOL"            "QUALITY"        
[13] "HIGHWAY"        
Show code
glimpse(home)
Rows: 522
Columns: 13
$ ID              <dbl> 1, 2, 3, 4, 5, 6, 7, 8, 9, 10, 11, 12, 13, 14, 15, 16,…
$ SALES_PRICE     <dbl> 360000, 340000, 250000, 205500, 275500, 248000, 229900…
$ FINISHED_AREA   <dbl> 3032, 2058, 1780, 1638, 2196, 1966, 2216, 1597, 1622, …
$ BEDROOMS        <dbl> 4, 4, 4, 4, 4, 4, 3, 2, 3, 3, 7, 3, 5, 5, 3, 5, 2, 3, …
$ BATHROOMS       <dbl> 4, 2, 3, 2, 3, 3, 2, 1, 2, 3, 5, 4, 4, 4, 3, 5, 2, 4, …
$ GARAGE_SIZE     <dbl> 2, 2, 2, 2, 2, 5, 2, 1, 2, 1, 2, 3, 3, 2, 2, 2, 2, 2, …
$ YEAR_BUILT      <dbl> 1972, 1976, 1980, 1963, 1968, 1972, 1972, 1955, 1975, …
$ STYLE           <dbl> 1, 1, 1, 1, 7, 1, 7, 1, 1, 1, 7, 1, 7, 5, 1, 6, 1, 7, …
$ LOT_SIZE        <dbl> 22221, 22912, 21345, 17342, 21786, 18902, 18639, 22112…
$ AIR_CONDITIONER <chr> "YES", "YES", "YES", "YES", "YES", "YES", "YES", "YES"…
$ POOL            <chr> "NO", "NO", "NO", "NO", "NO", "YES", "NO", "NO", "NO",…
$ QUALITY         <chr> "MEDIUM", "MEDIUM", "MEDIUM", "MEDIUM", "MEDIUM", "MED…
$ HIGHWAY         <chr> "NO", "NO", "NO", "NO", "NO", "NO", "NO", "NO", "NO", …
Which variables should probably be categorical and why?

  • Even if you code the factors as numbers, 1, 2, 3 it is not correct as it implies that the difference between LOW and MEDIUM is the same as between MEDIUM and HIGH.

Consider SALES_PRICE as a function of FINISHED_AREA

Show code
plot(home$FINISHED_AREA, home$SALES_PRICE)

Show code
ggplot(home, aes(x = FINISHED_AREA, y = SALES_PRICE)) +
  geom_point() +
  geom_smooth(se = FALSE)

The plot looks somewhat linear.

Let’s build a linear model

Show code
reg <- lm(SALES_PRICE ~ FINISHED_AREA, data = home)
summary(reg)

Call:
lm(formula = SALES_PRICE ~ FINISHED_AREA, data = home)

Residuals:
    Min      1Q  Median      3Q     Max 
-239405  -39840   -7641   23515  388362 

Coefficients:
                Estimate Std. Error t value Pr(>|t|)    
(Intercept)   -81432.946  11551.846  -7.049 5.74e-12 ***
FINISHED_AREA    158.950      4.875  32.605  < 2e-16 ***
---
Signif. codes:  0 '***' 0.001 '**' 0.01 '*' 0.05 '.' 0.1 ' ' 1

Residual standard error: 79120 on 520 degrees of freedom
Multiple R-squared:  0.6715,    Adjusted R-squared:  0.6709 
F-statistic:  1063 on 1 and 520 DF,  p-value: < 2.2e-16
Show code
plot(home$FINISHED_AREA, home$SALES_PRICE)
abline(reg, col = "blue", lwd = 4)

Show code
ggplot(home, aes(x = FINISHED_AREA, y = SALES_PRICE)) +
  geom_point() +
  geom_smooth(method = lm, se = FALSE)

Let’s add in QUALITY. Since it is of type “character” R will treat it as a factor with three levels.

Show code
regq <- lm(SALES_PRICE ~ FINISHED_AREA + QUALITY, data = home)
summary(regq)

Call:
lm(formula = SALES_PRICE ~ FINISHED_AREA + QUALITY, data = home)

Residuals:
    Min      1Q  Median      3Q     Max 
-230493  -31093   -7680   23993  326172 

Coefficients:
                Estimate Std. Error t value Pr(>|t|)    
(Intercept)    2.141e+05  2.014e+04   10.64   <2e-16 ***
FINISHED_AREA  9.844e+01  5.557e+00   17.71   <2e-16 ***
QUALITYLOW    -2.068e+05  1.295e+04  -15.97   <2e-16 ***
QUALITYMEDIUM -1.689e+05  1.030e+04  -16.40   <2e-16 ***
---
Signif. codes:  0 '***' 0.001 '**' 0.01 '*' 0.05 '.' 0.1 ' ' 1

Residual standard error: 63640 on 518 degrees of freedom
Multiple R-squared:  0.7883,    Adjusted R-squared:  0.7871 
F-statistic:   643 on 3 and 518 DF,  p-value: < 2.2e-16

You can change the ordering of the levels for the categorical variable if you wish.

Show code
home$QUALITYF <- factor(home$QUALITY, levels = c("LOW", "MEDIUM", "HIGH"))
regqf <- lm(SALES_PRICE ~ FINISHED_AREA + QUALITYF, data = home)
summary(regqf)

Call:
lm(formula = SALES_PRICE ~ FINISHED_AREA + QUALITYF, data = home)

Residuals:
    Min      1Q  Median      3Q     Max 
-230493  -31093   -7680   23993  326172 

Coefficients:
                Estimate Std. Error t value Pr(>|t|)    
(Intercept)    7.355e+03  1.069e+04   0.688    0.492    
FINISHED_AREA  9.844e+01  5.557e+00  17.715  < 2e-16 ***
QUALITYFMEDIUM 3.792e+04  7.103e+03   5.339  1.4e-07 ***
QUALITYFHIGH   2.068e+05  1.295e+04  15.970  < 2e-16 ***
---
Signif. codes:  0 '***' 0.001 '**' 0.01 '*' 0.05 '.' 0.1 ' ' 1

Residual standard error: 63640 on 518 degrees of freedom
Multiple R-squared:  0.7883,    Adjusted R-squared:  0.7871 
F-statistic:   643 on 3 and 518 DF,  p-value: < 2.2e-16

What do you notice about the output?

  • The levels and estimates both change compared to the baseline level.

Let’s plot

Show code
Yhat <- predict(regq)
plot(home$FINISHED_AREA, home$SALES_PRICE)
abline(reg, col = "red", lwd = 4)
points(home$FINISHED_AREA, Yhat, col = as.numeric(as.factor(home$QUALITY)), lwd = 4)

What about the plot for the re-ordered factor?

Show code
Yhat <- predict(regqf)
plot(home$FINISHED_AREA, home$SALES_PRICE)
abline(reg, col = "red", lwd = 4)
points(home$FINISHED_AREA, Yhat, col = as.numeric(as.factor(home$QUALITY)), lwd = 4)

Show code
ggplot(home, aes(x = FINISHED_AREA, y = SALES_PRICE, color= QUALITY)) +
  geom_point(alpha = .5, color = "black") +
  geom_smooth(method = lm, se = FALSE, color = "red", lty = 2) +
  geom_smooth(method = lm, se = FALSE)

Why are there different slopes?

Using geom_abline() for the fits.

Show code
ggplot(home, aes(x = FINISHED_AREA, y = SALES_PRICE, color= QUALITY)) +
  geom_point(alpha = .5) +
  geom_smooth(method = lm, se = FALSE, color = "red", lty = 2) +
  geom_abline(slope = regq$coefficients[[2]], intercept = regq$coefficients[[1]], 
              color = "red", lwd = 2, alpha = .5) +
  geom_abline(slope = regq$coefficients[[2]], intercept = regq$coefficients[[1]] + regq$coefficients[[3]], color = "green", lwd = 2, alpha = .5) +
  geom_abline(slope = regq$coefficients[[2]], intercept = regq$coefficients[[1]]+  regq$coefficients[[4]], color = "blue", lwd = 2, alpha = .5) 

Now let’s consider the possibility of interactions

Show code
regqi <- lm(SALES_PRICE ~ FINISHED_AREA * QUALITY, data = home)
summary(regqi)

Call:
lm(formula = SALES_PRICE ~ FINISHED_AREA * QUALITY, data = home)

Residuals:
    Min      1Q  Median      3Q     Max 
-213636  -28346   -7513   22844  345011 

Coefficients:
                              Estimate Std. Error t value Pr(>|t|)    
(Intercept)                  337741.58   38399.28   8.796  < 2e-16 ***
FINISHED_AREA                    61.51      11.25   5.469 7.06e-08 ***
QUALITYLOW                  -289323.12   47313.96  -6.115 1.91e-09 ***
QUALITYMEDIUM               -333828.69   41670.87  -8.011 7.62e-15 ***
FINISHED_AREA:QUALITYLOW         12.82      19.54   0.656    0.512    
FINISHED_AREA:QUALITYMEDIUM      54.75      13.14   4.167 3.62e-05 ***
---
Signif. codes:  0 '***' 0.001 '**' 0.01 '*' 0.05 '.' 0.1 ' ' 1

Residual standard error: 62570 on 516 degrees of freedom
Multiple R-squared:  0.7962,    Adjusted R-squared:  0.7942 
F-statistic: 403.2 on 5 and 516 DF,  p-value: < 2.2e-16

How do we interpret this output?

Let’s plot

Show code
Yhat <- predict(regqi)
plot(home$FINISHED_AREA, home$SALES_PRICE)
abline(reg, col = "red", lwd = 4)
points(home$FINISHED_AREA, Yhat, col = as.numeric(as.factor(home$QUALITY)), lwd = 4)

Show code
ggplot(home, aes(x = FINISHED_AREA, y = SALES_PRICE, color= QUALITY)) +
  geom_point(alpha = .5, color = "black") +
  geom_smooth(method = lm, se = FALSE, color = "red", lty = 2) +
  geom_smooth(method = lm, se = FALSE)

So should we include interactions or not?

3.8.1.4 Partial F test

Show code
anova(regq, regqi)
Analysis of Variance Table

Model 1: SALES_PRICE ~ FINISHED_AREA + QUALITY
Model 2: SALES_PRICE ~ FINISHED_AREA * QUALITY
  Res.Df        RSS Df  Sum of Sq      F    Pr(>F)    
1    518 2.0980e+12                                   
2    516 2.0199e+12  2 7.8075e+10 9.9722 5.633e-05 ***
---
Signif. codes:  0 '***' 0.001 '**' 0.01 '*' 0.05 '.' 0.1 ' ' 1

How do we interpret this?

  • The \(p\)-value is small so … .

3.9 Goodness-of-Fit aka Lack-of-Fit Tests

Goodness of Fit or Lack-of-Fit is a discussion about over-fitting and under-fitting.

It is about testing if a linear model (the first LINE assumption) is a good fit to explain the relationship between \(Y\) and \(X\) as expressed in

\[ \vec{Y} = \bf{X}\vec{\beta} + \vec{\epsilon} \tag{3.22}\]

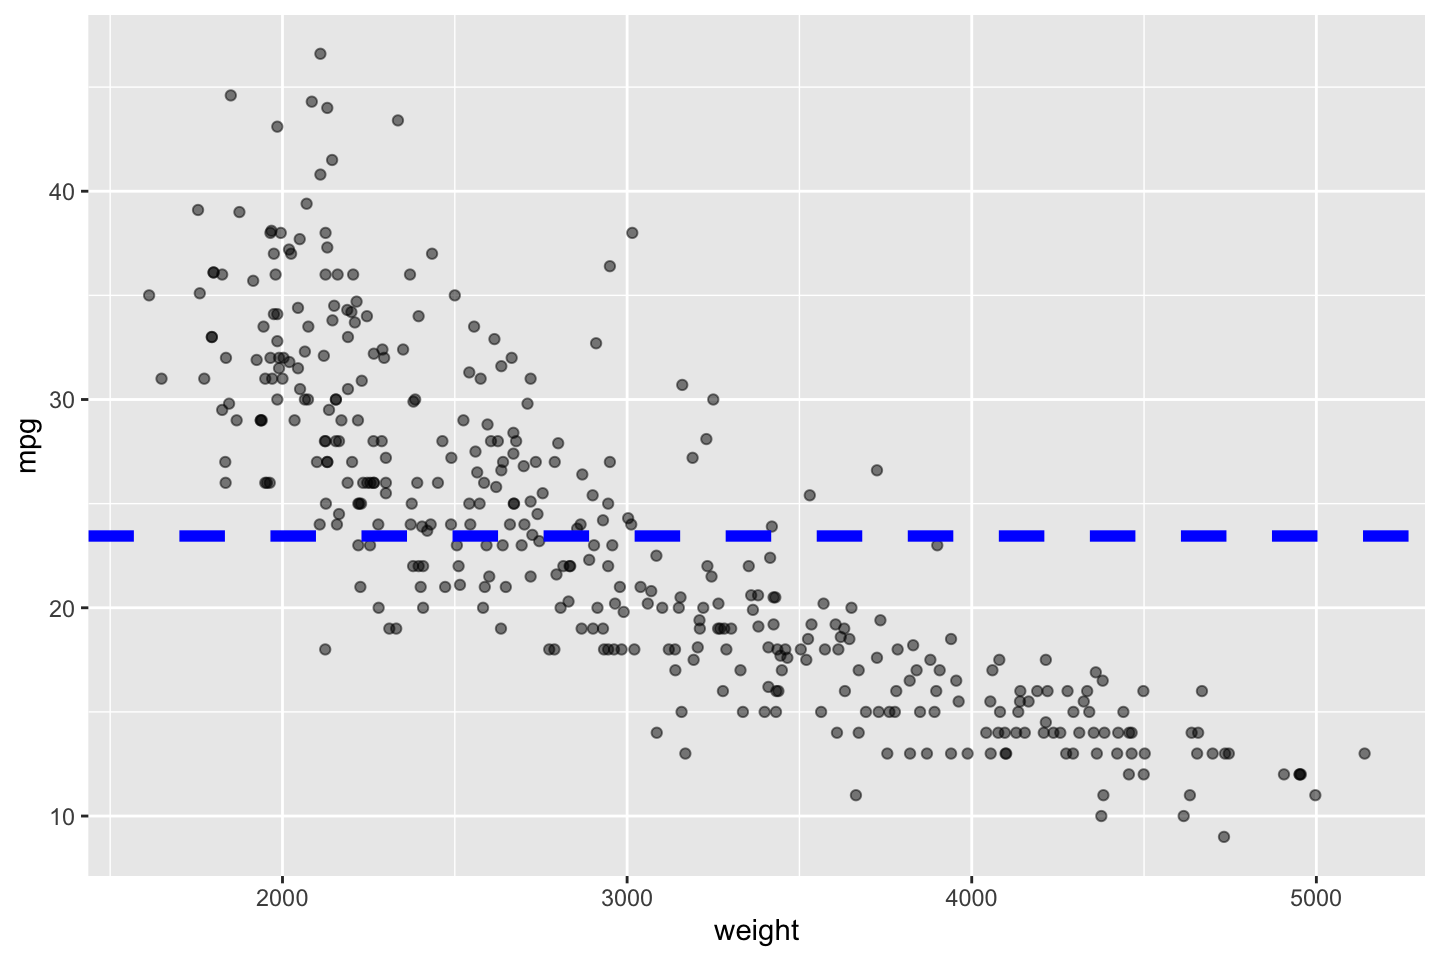
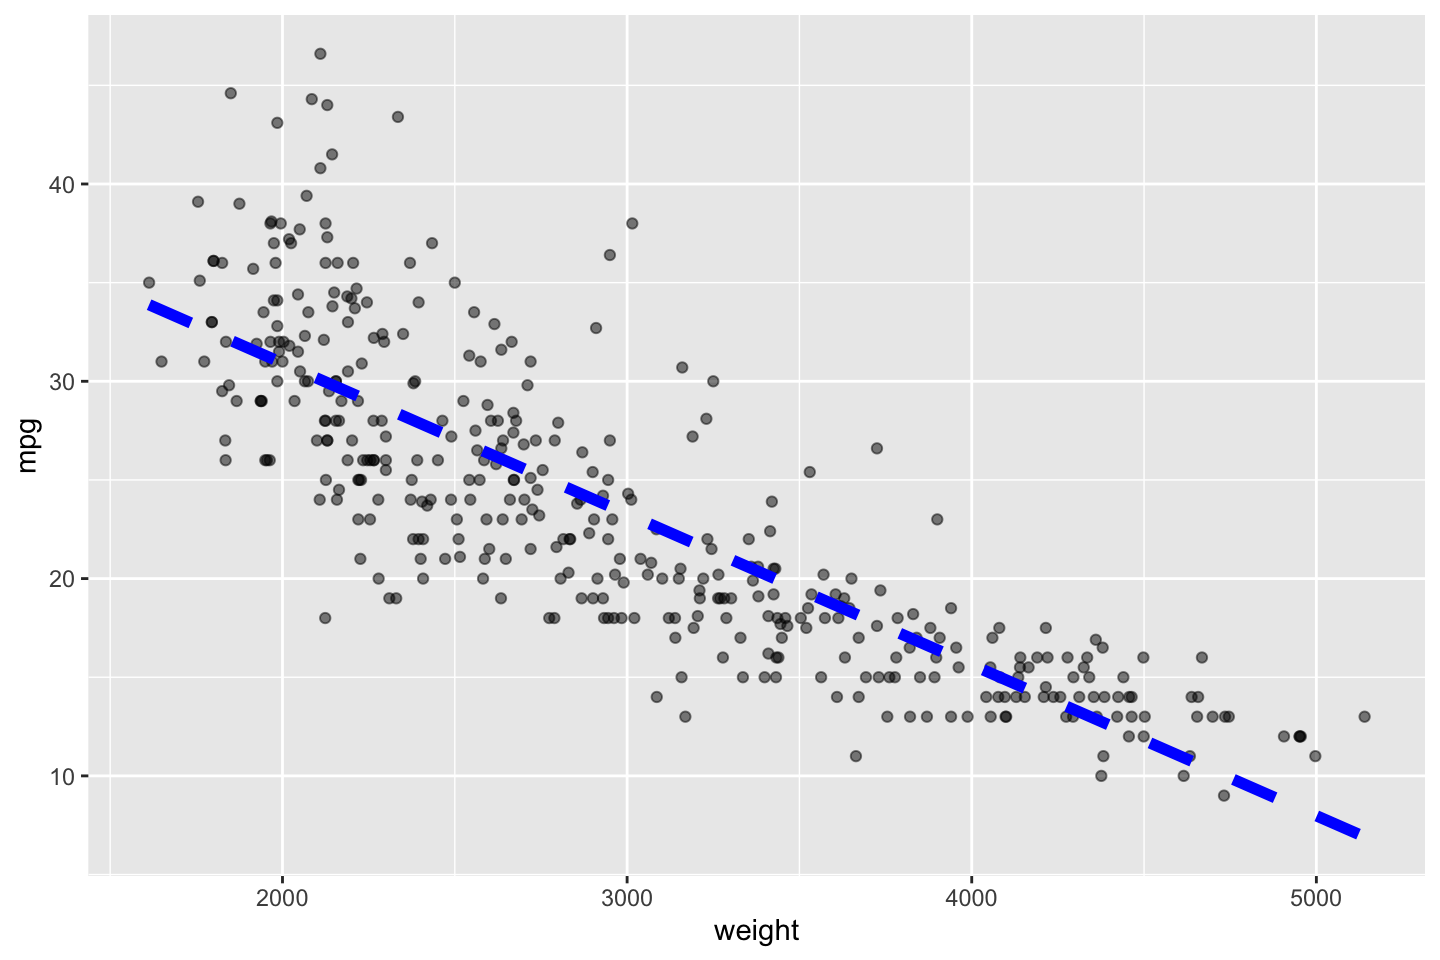
In Linear Regression, the Null hypothesis \(H_0: \vec{\beta} = 0\) asserts there is no relationship between \(Y\) and \(\bf{X}\) versus an alternative of there is a linear trend or component to the relationship between \(Y\) and \(\bf{X}\).

Show code
ggplot(Auto, aes(weight, mpg )) +
  geom_point(alpha = .5) +
  geom_hline(yintercept = mean(Auto$mpg, na.rm = TRUE),
             color = "blue", lty = 2, lwd = 2)

ggplot(Auto, aes(weight, mpg )) +
  geom_point(alpha = .5) +
  geom_smooth(method = lm, se = FALSE,
              color = "blue", lty = 2, lwd = 2)
Figure 3.4: H0: No Linear Component
Figure 3.5: HA: Linear Component
  • Note

    This is not a test for linearity though.

A test for linearity tests whether the linear component is a good fit or are there are any non-linear trends or components that would create a better fit to true relationship.

The terms goodness-of-fit test, test for linearity, and lack-of-fit test are synonymous with each other in our context.

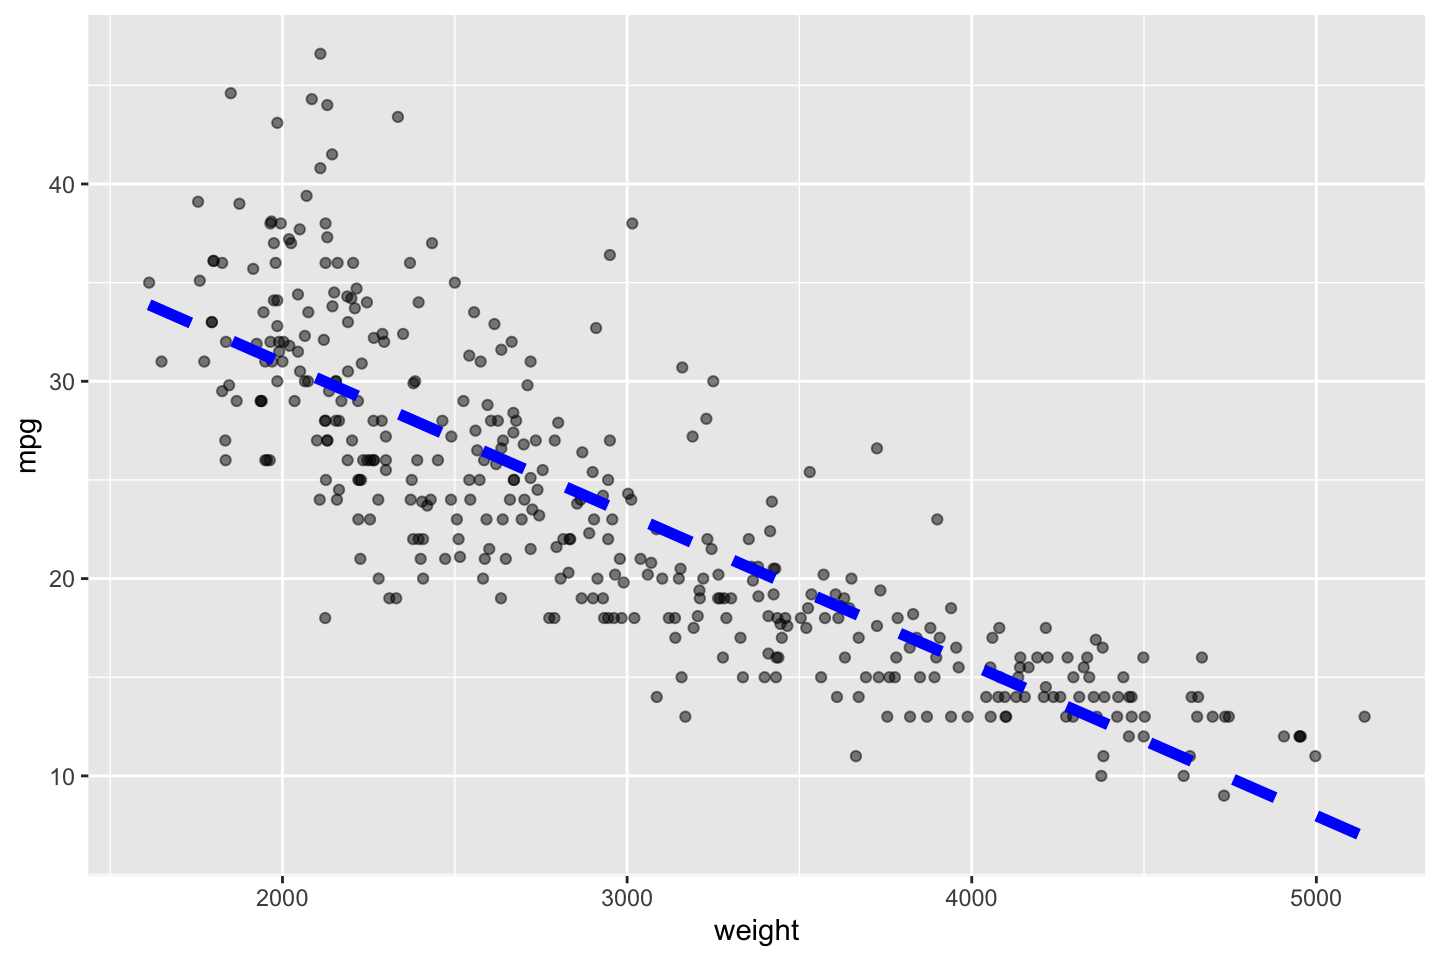
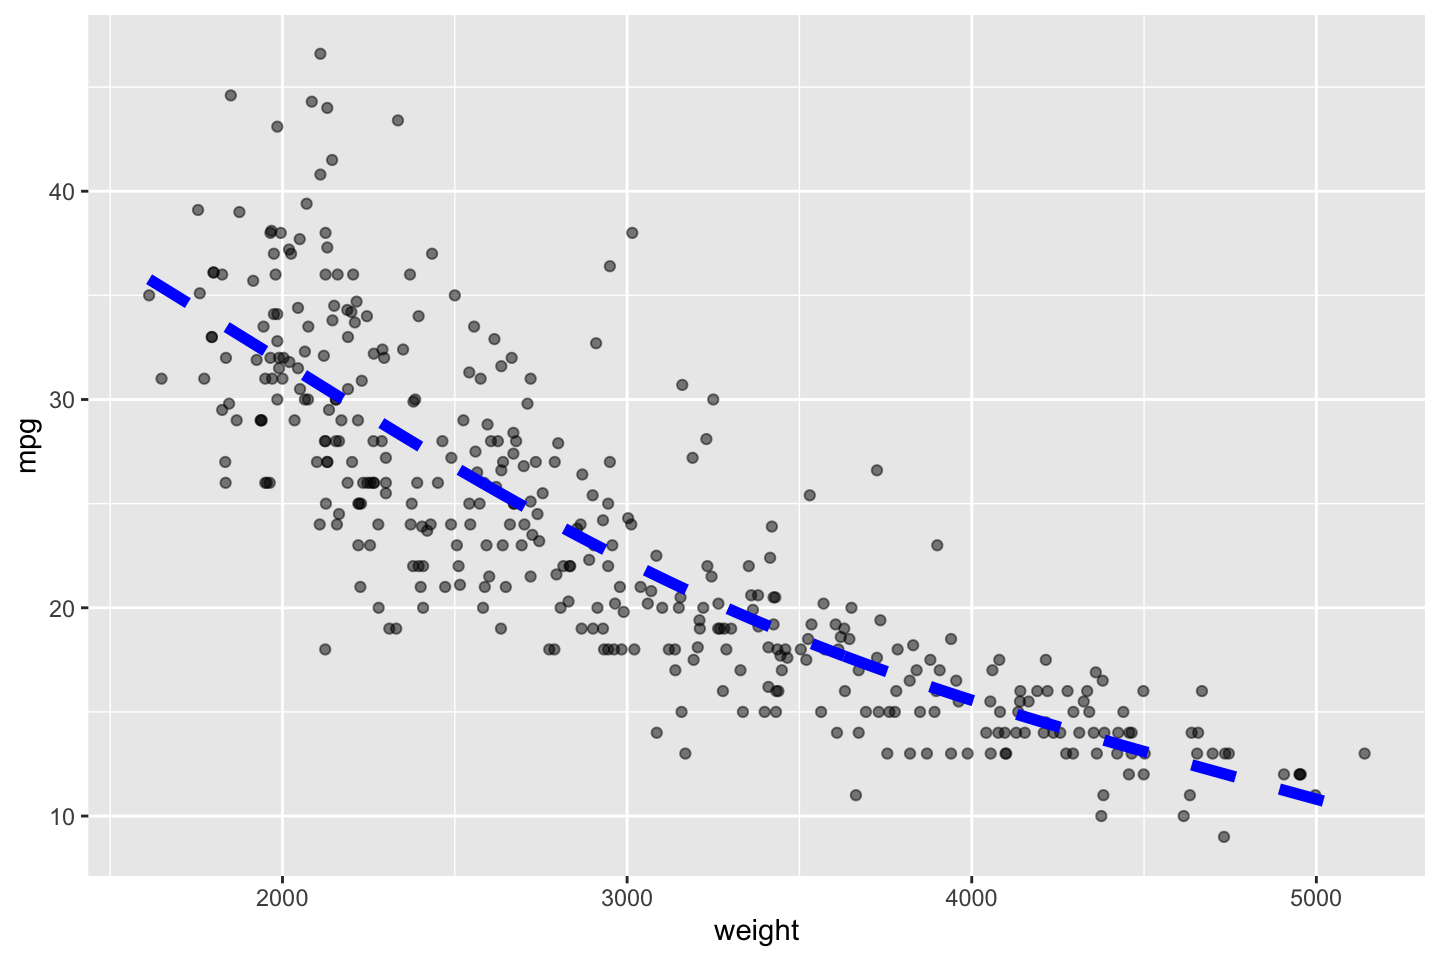
We saw in Section 2.5.5 that mpg vs weight has a non-linear component and if we fit multiple splines, the best fit seemed to have about 3 degrees of freedom – a quadratic fit.

Show code
ggplot(Auto, aes(weight, mpg )) +
  geom_point(alpha = .5) +
  geom_smooth(method = lm, se = FALSE,
              color = "blue", lty = 2, lwd = 2)

ggplot(Auto, aes(weight, mpg )) +
  geom_point(alpha = .5) +
  ggformula::geom_spline(df = 3.3, se = FALSE,
             color = "blue", lty = 2, lwd = 2)
Figure 3.6: H0: Linear Component
Figure 3.7: HA: Non-Linear Components
  • Important
    • The test for linearity will just tell you that there is a lack of fit; it’s a diagnostic tool.

    • It will not suggest a remedy for the lack of fit.

  • Here we can just see if a Linear Regression is an under-fit, not what model might fit the data best.

  • We will talk about methods for non-linear solutions later.

3.9.0.1 A Saturated Model

The Lack-of-Fit test investigates hypotheses about whether a non-linear function \(g(x)\) best fits the data compared to a linear function in terms of minimizing the MSE .

Equation 3.22 is the Null hypothesis:

\[ H_0: \underbrace{\vec{Y} = \bf{X}\vec{\beta} + \vec{\epsilon}}_{\text{Linear Regression Model}} \text{ vs }\quad H_A: \underbrace{\vec{Y} = g(\bf{X}) + \vec{\epsilon}}_{\text{Saturated Regression Model}} \tag{3.23}\]

The Alternative model is a Saturated Regression Model, the most general model we can create, with maximum flexibility.

We will estimate the saturated \(g(\bf{X})\) based on the values of \(\bf{X}\).

  • For a single value of \(x_i\), with multiple (\(k\)) responses \(y_{i,k}\), the most general model is \(y_{i,k} = g(x_i) + \epsilon\)
  • We can estimate \(g(x_i)\) by using the average of the \(y_{i,k}\). This is also the least squares estimate, \(\bar{y_{x_i}}\).
Show code
df <- tribble(~x, ~y,
              1, 2,
              1, 4,
              1, 5
)
              
    ggplot(df, (aes(x, y))) +
      geom_point() +
      geom_point(aes(x = mean(x), y = mean(y)), color = "red", pch = 4, size = 5) +
      ylab("g(x)")

We can show this as follows

  • The least squares goal is to find a function \(\hat{g}(x)\) which minimize the sum of the squared residuals, a quadratic (parabolic) function of \(g(x)\).

\[ \hat{g}(x) = g(x) \text{that minimizes }\sum_{i=1}^k(y_i - g(x))^2 = kg^2(x) - 2g(x)\sum(y_i) + \sum(y_i^2) \tag{3.24}\]

  • From calculus, functions of the form \(ax^2 + bx + c\) are minimized when their first derivative \(2ax + b =0.\)
  • That means the solution for the minimum of the function is \(x = -\frac{b}{2a}\).
  • We can use that information with Equation 3.24 to show

\[ \begin{align} \hat{g}(x) & = -\frac{b}{2a} = -\frac{-2\sum (y_i) }{2(k)} \\ & = \frac{\sum (y_i) }{k} \\ & = \bar{y} \quad \text{ the average of all responses for a given }x. \end{align} \]

Since we want \(g(x)\) to be the most flexible, we will allow for different values of \(g(x)\) for each different \(x_j\).

3.9.0.2 Testing for Lack-of-Fit

Let’s consider the Linear Regression as a Reduced Model (\(H_0\)) and the Saturated Regression as the Full Model (\(H_A\)).

Let’s compare the two models using a Partial \(F\)-test as in Section 3.6 .

Break out the Total Sum of Squares as in Equation 3.17 but for a lack-of-fit test.

Split the Total Sum of Squares into

  • \(SS_{Reg}^{LR}\) for the Linear Regression fit (reduced model) and
  • \(SS_{Err}^{LR}\) for the error sum of squares from the Linear Regression fit.

Now, break the \(SS_{Err}^{LR}\) into two components for the full or saturated model, a linear regression that includes all the possible non-linear components of the true \(g(x)\) plus noise \(\epsilon\).

\[ \begin{align} & SS_{Total} \\ \swarrow & \searrow \\ \underbrace{SS_{Reg}^{LR}}_\text{Explained Variation: Lin Reg} & \quad \underbrace{SS_{Error}^{LR}}_\text{Unexplained Variation: Lin} \\ &\qquad \qquad \quad\quad\swarrow \searrow \\ &\underbrace{SS_{Lack of Fit}^{Saturated}}_\text{Extra Explained Non-linear} \quad \underbrace{SS_{Pure Error}^{Saturated}}_\text{Unexplained Variation: Noise} \end{align} \tag{3.25}\]

  • The \(SS_{Pure Error}\) captures all of the inherent variability in the data that cannot be explained by a non-linear model.
    • As an example, when there are multiple values of \(y_i\) for a given \(x\), they cannot be reconciled with a non-linear \(g(x)\). The variance is irreducible.
  • The \(SS_{Lack of Fit}\) is how much variation could be explained by a non-linear model that is not explained by a linear model.
  • In other words, it contains the variation captured or contained by the non-linear terms.

The \(SS_{Pure Error}\) and \(SS_{Lack of Fit}\) are independent so we can compare them using

\[ F_{stat} = \frac{MS_{LOF}}{MS_{PE}} \]

It’s straightforward to create the saturated model and compute the \(F\)-test in R.

3.9.0.3 Lack-of-Fit Test Example in R using the Home Sales data.

Given a plot, the question is whether the relationship is non-linear or linear. We know from before the slope is not zero.

Show code
plot(home$FINISHED_AREA, home$SALES_PRICE)
reg <- lm(SALES_PRICE ~ FINISHED_AREA, data = home)
abline(reg, col = "red", lwd = 4)

Show code
summary(reg)

Call:
lm(formula = SALES_PRICE ~ FINISHED_AREA, data = home)

Residuals:
    Min      1Q  Median      3Q     Max 
-239405  -39840   -7641   23515  388362 

Coefficients:
                Estimate Std. Error t value Pr(>|t|)    
(Intercept)   -81432.946  11551.846  -7.049 5.74e-12 ***
FINISHED_AREA    158.950      4.875  32.605  < 2e-16 ***
---
Signif. codes:  0 '***' 0.001 '**' 0.01 '*' 0.05 '.' 0.1 ' ' 1

Residual standard error: 79120 on 520 degrees of freedom
Multiple R-squared:  0.6715,    Adjusted R-squared:  0.6709 
F-statistic:  1063 on 1 and 520 DF,  p-value: < 2.2e-16

We can look at the residual vs fitted plot from the regression model to see if there is some non-linearity.

Show code
plot(reg, which = 1)

This plot is not conclusive as it could be interpreted differently by different people.

For a more objective check, let’s use the \(F\)-test.

How do we get R to fit a saturated model??

  • We saw that R fit different levels of a categorical variable separately, as dummy variables, where each got their own \(\beta_j\) estimate.
  • Let’s try that here with FINISHED_AREA.
  • Turn the quantitative variable into a categorical variable with as.factor()
saturated <- lm(SALES_PRICE ~ as.factor(FINISHED_AREA), data = home)
#summary(saturated)

It’s a long summary but we don’t really care.

Let’s do the partial \(F\)-test

Show code
anova(reg, saturated)
Analysis of Variance Table

Model 1: SALES_PRICE ~ FINISHED_AREA
Model 2: SALES_PRICE ~ as.factor(FINISHED_AREA)
  Res.Df        RSS  Df  Sum of Sq      F    Pr(>F)    
1    520 3.2554e+12                                    
2    107 3.3303e+11 413 2.9224e+12 2.2735 5.208e-07 ***
---
Signif. codes:  0 '***' 0.001 '**' 0.01 '*' 0.05 '.' 0.1 ' ' 1

We can see that there is a large sum of squares.

Are there repeated values of X?

Show code
nrow(home) - length(unique(home$FINISHED_AREA))
[1] 107
Show code
nrow(home) - nlevels(as.factor(home$FINISHED_AREA))
[1] 107

Using broom::glance() we can see the df.residual is 107 out of 522 observations so there are repeated values and therefore irreducible error in the total sum of squares.

Show code
broom::glance(saturated)$df.residual
[1] 107

What if there were no repeated values of \(X\)?

  • Then, every point is fit by \(y_i\) and the \(SS_{Pure} = 0\), so you can’t do the \(F\)_test.

Use rounding to create some repeats in the \(X\).

  • A “technique” is to divide by 100, round to an integer, and then multiply by 100.
Show code
X <-  round(home$FINISHED_AREA/100) * 100
head(X)
[1] 3000 2100 1800 1600 2200 2000
Show code
length(unique(X))
[1] 38

Let’s plot the rounded \(X\) with the original values

Show code
plot(home$FINISHED_AREA, home$SALES_PRICE)
points(X, home$SALES_PRICE, col = "blue", lwd = .3, pch = 15)

We can now do a new saturated model and plot the fitted values.

Show code
saturated_r <- lm(home$SALES_PRICE ~ as.factor(X))
Yhat <- predict(saturated_r)
plot(home$FINISHED_AREA, home$SALES_PRICE)
points(X, home$SALES_PRICE, col = "blue", lwd = .3, pch = 15)
points(X, Yhat, col = "red", lwd = 5)

We can see the red dots are not on a straight line.

However, is the variation just due to noise or non-linear effects?

That is what the Lack of Fit test is testing.

Let’s rerun the linear model with the rounded \(X\) (not as a factor) and compare.

Show code
reg_r <- lm(home$SALES_PRICE ~ (X))
anova(reg_r, saturated_r)
Analysis of Variance Table

Model 1: home$SALES_PRICE ~ (X)
Model 2: home$SALES_PRICE ~ as.factor(X)
  Res.Df        RSS Df  Sum of Sq      F    Pr(>F)    
1    520 3.2449e+12                                   
2    484 2.5741e+12 36 6.7079e+11 3.5036 2.492e-10 ***
---
Signif. codes:  0 '***' 0.001 '**' 0.01 '*' 0.05 '.' 0.1 ' ' 1

How do we interpret this?

  • There is some non-linear component that is significant.

3.9.0.4 Multivariate Lack of Fit

It’s a more complicated model when you have multiple predictors.

We have to estimate \(g(X_i, X_2, \ldots, X_p)\) for every combination of \(X_i, X_2, \ldots, X_p\).

That means calculating a \(\bar{y}_{x_1, X2, \ldots, x_p}\) for every combination.

With the potential sparsity of higher dimensions, we may have to do rounding to get some repeat values of \(X_i, X_2, \ldots, X_p\).

3.10 Summary

This finishes our review of Linear Regression.

We looked at key ideas around the following:

  • Method of Least Squares Regression
  • The four LINE assumptions for Linear Regression
  • Testing the Significance of individual estimates \(\beta_j\) with a \(t\)-test.
  • Splitting the Total Sum of Squares and their Degrees of Freedom
  • Testing the significance of multiple estimates with an \(F\)-test
  • Comparing Full and Reduced models using a Partial \(F\)-test
  • The Use of Dummy Variables for categorical predictors
  • A Goodness-of-Fit or Lack-of-Fit test for Linearity with a Saturated model

3.10.1 Review of the Terms Used in Regression

The Same Concepts can have Different Names in the Literature

Different sources use different terms for the same statistics, concepts, or quantities.

  • Total Sum of Squares (TSS): The sum of the squared differences between the \(y_i\) and the sample mean \(\bar{y}\), independent of any model or predictors \(X\). The total sum of squares can be broken out into components for the error and the model or treatments.
  • Error Sum of Squares (SSE or \(SS_{Err}\)): Sum of the squared differences between the \(\hat{y}_i\) and \(y_i.\) Some use the term Residual Sum of Squares (RSS). This is the remaining or unexplained variability in the \(y_i\).
  • Regression Sum of Squares (SSR or \(SS_{reg}\)): Sum of the squared differences between the \(\hat{y}_i\) and \(\bar{y}.\) Some use the term Model Sum of Squares (MSS), or Explained Sum of Squares (ESS). In Analysis of Variance contexts, one may see the term Sum of Squares Treatments. This is the variability in the \(y_i\) that is explained by the regression model or treatments.

Two models are Nested, when one model, the Full Model, has all of the predictors in the Reduced Model, plus at least one additional predictor.

When comparing a Full Model to a Reduced models, the SSE of the Reduced model (\(SSE_{Reduced}\)) can be partitioned into two components:

  • Extra Sum of Squares: The sum of the squared differences between the \(\hat{y}_{i}^{Full}\) and the \(y_{i}^{Reduced}\). Some use the term Sequential Sum of Squares. This is the variability in the residuals from the Reduced Model, \(\hat{y}_{i}^{Reduced} - y_i\), that is explained by the additional predictors in the Full Model.
  • Error Sum of Squares Full (\(SSE^{Full}\)): The sum of the squared differences between the \(\hat{y}_{i}^{Full}\) and the \(y_i.\) This is the variability in \(y_i\), that is not explained by the Full Model. It will include any irreducible error, also known as pure error.

Each of these statistics are random variables and have an expected value.

  • The Expected Value of the statistic is calculated by dividing by Sum of Squares by the number of the degrees of freedom used to generate the Sum of Squares.
  • The Degrees of Freedom are partitioned along with the Sum of Squares from the Total Degrees of Freedom, i.e., the number of observations or the sample size of the \(Y\).
  • The Expected Value of a Sum of Squares is called the Mean Sum of Squares.
  • The Mean Squared Error (MSE) is expected value of the Error Sum of Squares which is calculated as \(SSE/(n-(p+1)).\)

Each of these Sums of Squares can be calculated for the Training data or the Test data.

  • The Training Error Sum of Squares is the sum of the squared differences between the \(\hat{y}_i\) and \(y_i\) calculated based only on the \(y_i\) present in the training data which is used to estimate the parameters of the model.
  • The Testing (or Prediction) Error Sum of Squares is the sum of the squared differences between the \(\hat{y}_i\) and \(y_i\) calculated based only on the \(y_i\) present in the testing data and the \(\hat{y}\) are calculated using the parameters \(\beta_j\) estimated using the training data.