8  Fitting Models

Published

May 23, 2025

Keywords

Overfitting, Bias-Variance Tradeoff, Splines, Regularization

8.1 Introduction

This module explores concepts and examples for choosing between models of reality based on data while navigating the complexities suggested in the following two statements.

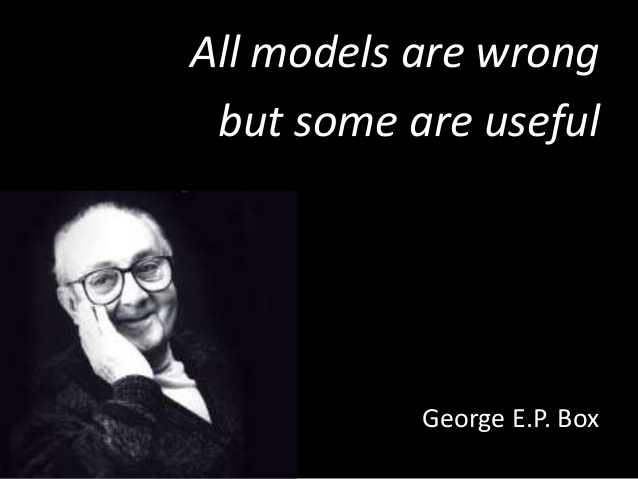
George Box: All Models are wrong, but some are useful.
Figure 8.1: World famous statistician George E.P. Box

We all know that art is not truth. Art is a lie that makes us realize truth, at least the truth that is given us to understand. The artist must know the manner whereby to convince others of the truthfulness of his lies.

— Picasso, Pablo (1923)

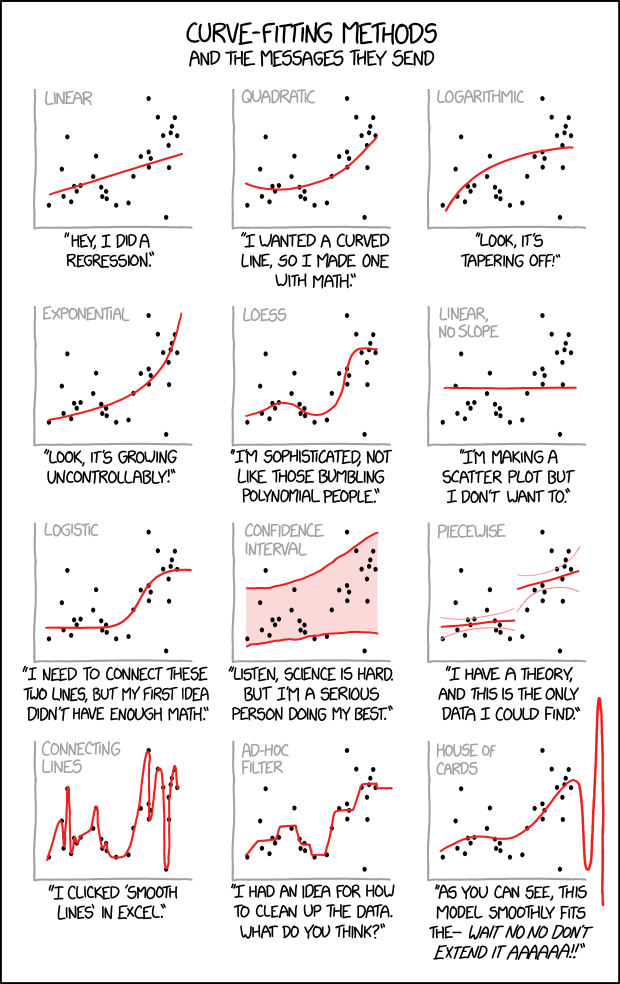
XKCD also has a thought-provoking perspective we should consider.

XKCD comic on Curve Fitting Messages.

Learning Outcomes

  • Explain the Machine Learning concepts such as overfitting, flexible and restrictive models, and the bias-variance trade off.
  • Explain the purpose of training and test data sets for comparing models.
  • Explain the role of prediction error when comparing models.
  • Explain why regularization methods are used with ML models and what they can do.

8.1.1 References

8.2 Review of (Statistical) Machine Learning (SML)

SML can be thought of as collection of algorithms for building models of reality using data

  • to better understand (“learn”) the relationships among the variables in the data,
  • make predictions about new observations,
  • and asses the models’ performance,
  • all in a repeatable manner.

SML algorithms are:

  • Programmed on a computer (so can be repeated).
  • Evaluated quantitatively (using a computer) where prediction accuracy is our main measure of performance.
  • Tuned - optimized. Every machine learning model can be adjusted and improved.
Important

From a conceptual perspective, given a data set, SML algorithms estimate some fixed but unknown mathematical relationship between the variables.

  • The algorithm tries to use the information in the data to create a model that mimics this unknown relationship so given new data, it can predict the true value of response variable,
    • where the predicted value is close to the true value, i.e., the residual error or difference between the two is very small.

8.2.1 SML Can Help Answer Two Types of Questions

  • Inference: How are the variables related? Which ones are more important? Can I quantify my uncertainty?
  • Prediction: How well can we make predictions using new data?

Your questions will guide how you make decisions in building and choosing a “best” model based on your data.

8.2.2 Supervised or Unsupervised Learning?

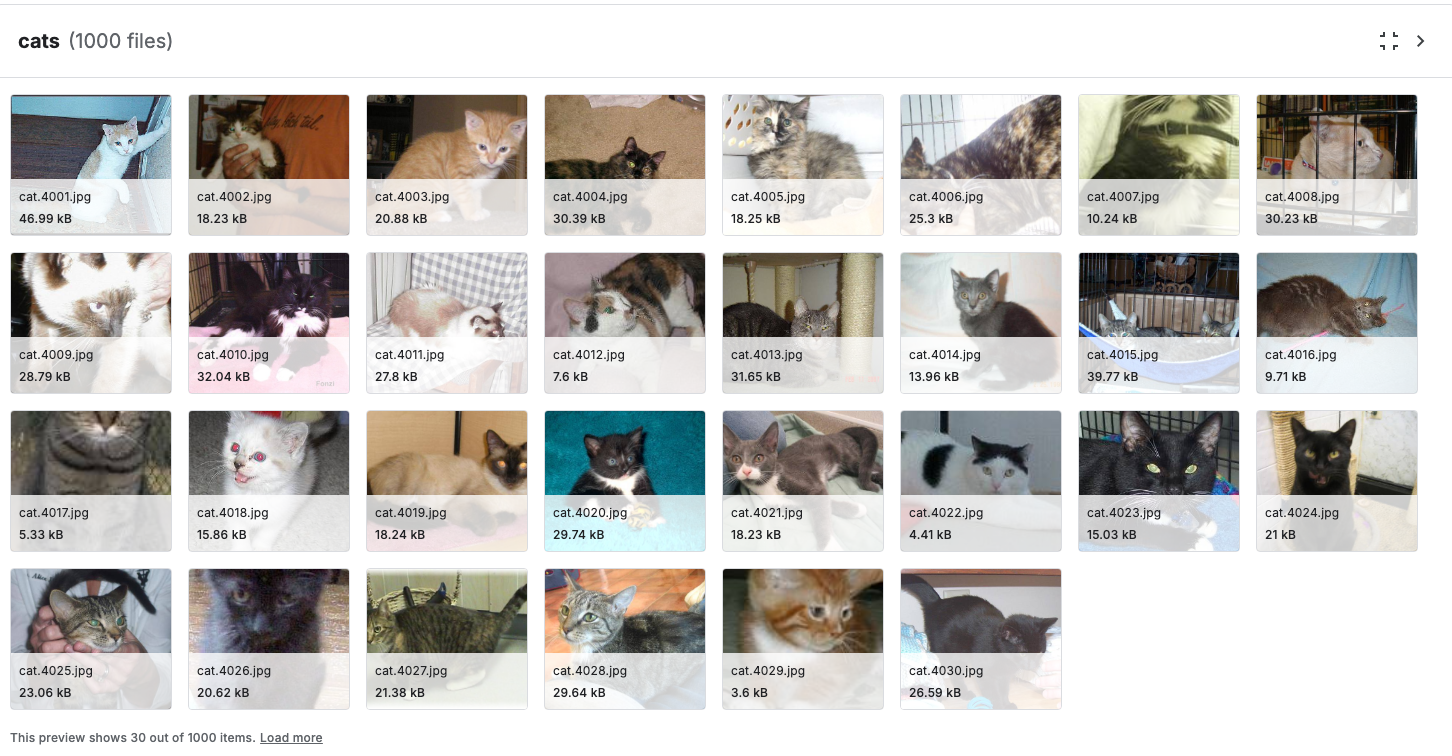
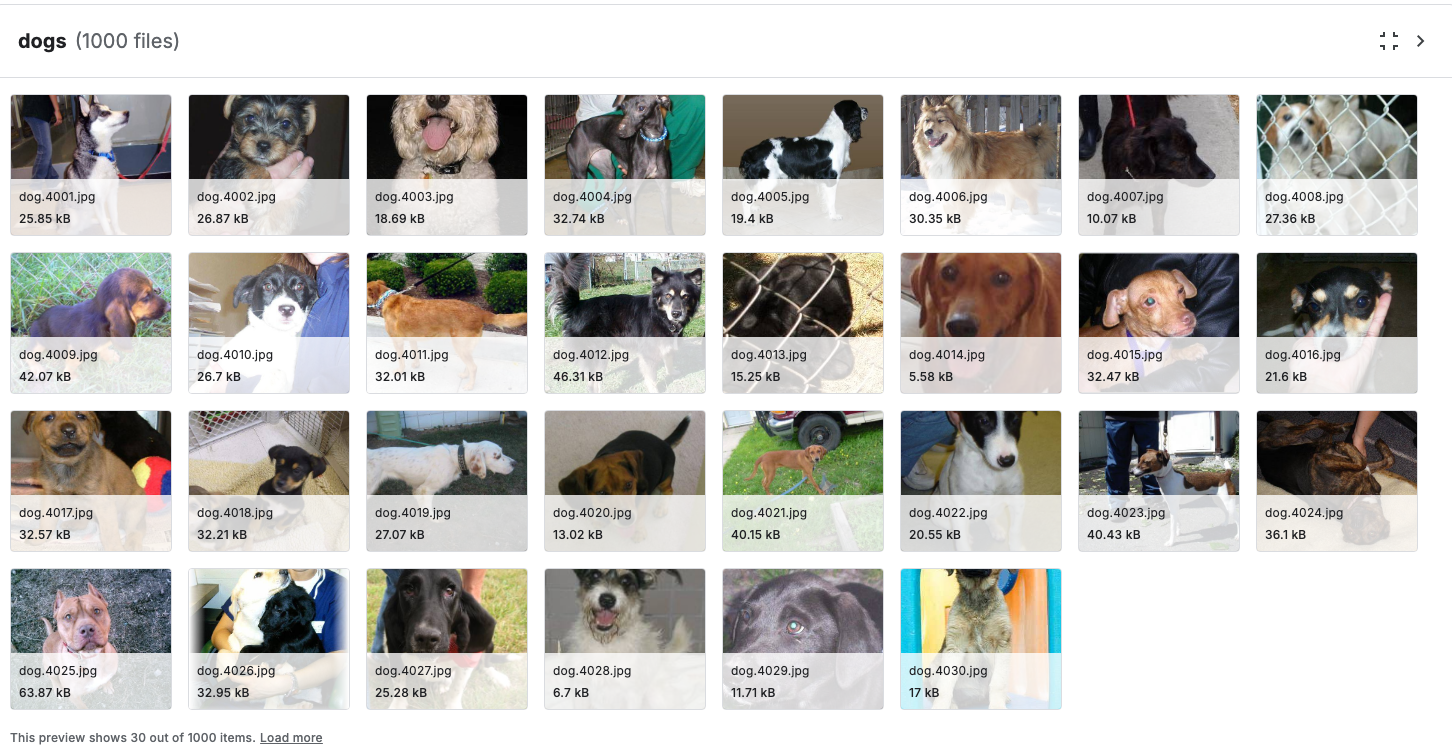
Is there is a labeled response variable you can use for comparison?

(a) Labeled as Cats
(b) Labeled as Dogs
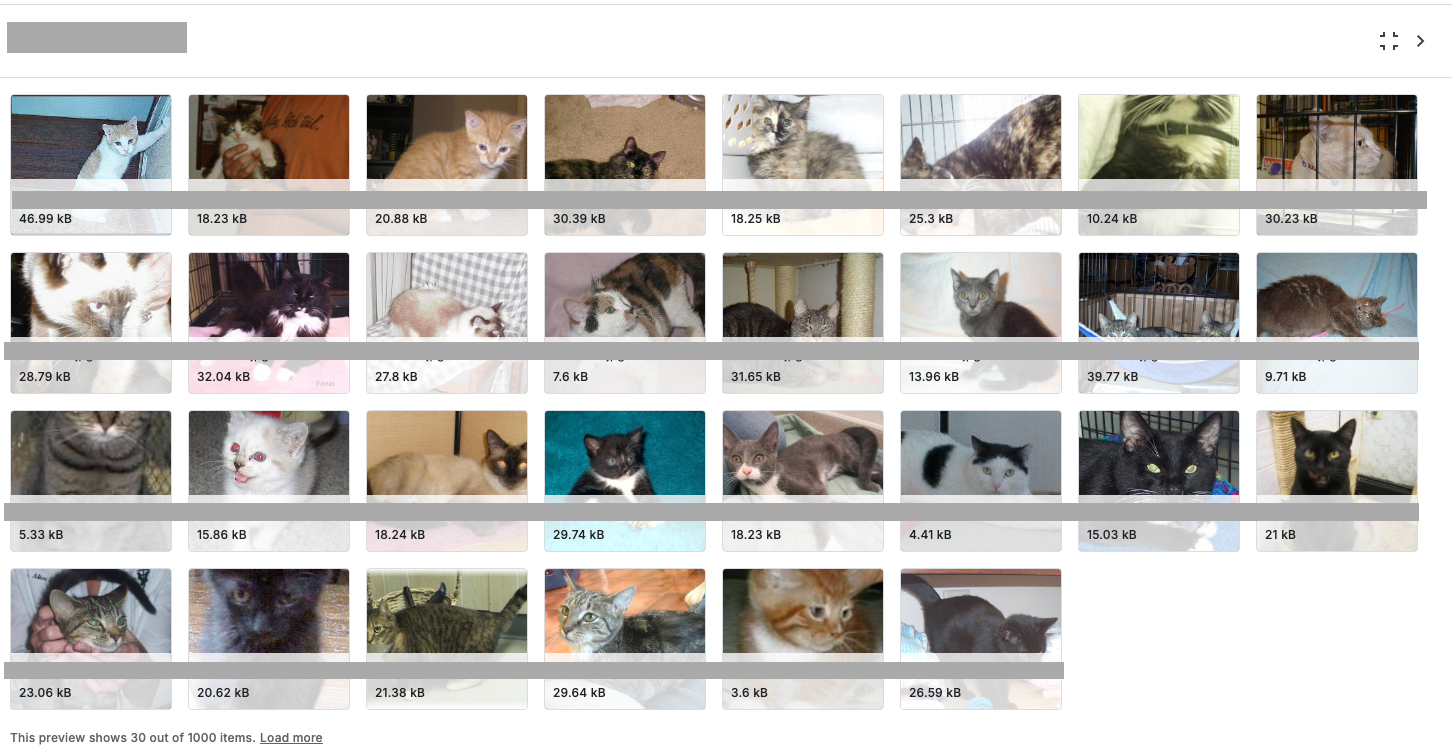
(c) Unlabeled Images
(d) More unlabeled Images
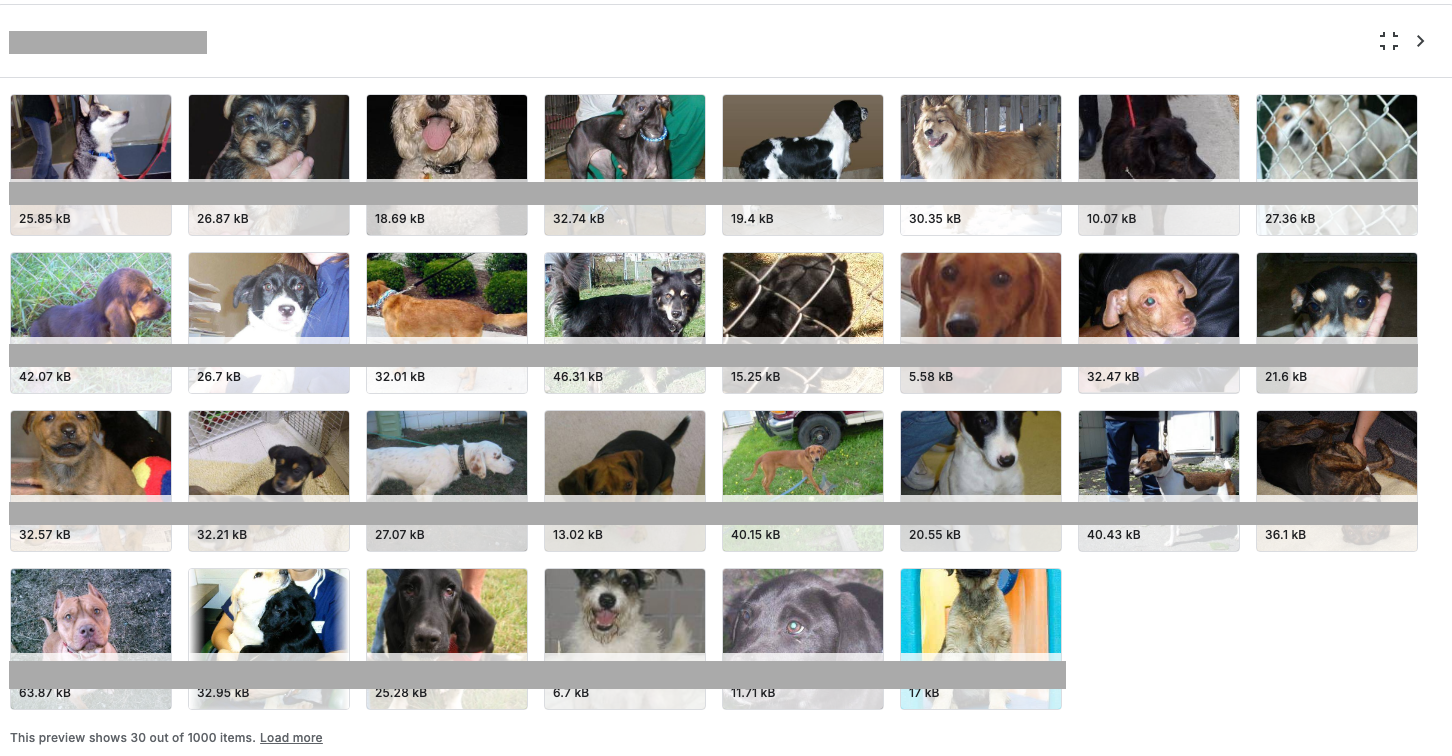
Figure 8.2: Same images, but some are labeled so the algorithm “knows” the image is a Cat or Dog as input and can compare a prediction to the “known” value. The second set is unlabeled so the algorithm has to determine how to distinguish among the possible groups of images.
  • The goal of Supervised learning is to build a model where the variables can accurately predict the associated response for a given set of input values.
    • For inference, we want to understand which predictors are useful or not and by how much in our predictions.
    • Methods include multiple forms of Regression or Classification.
  • The goal of Unsupervised Learning is to identify possible relationships among variables when there is no labeled response variable.
    • We want to find the “features” that help us differentiate or identify outcomes.
    • Methods include classification, clustering, and principal components

8.2.3 Regression or Classification?

  • Regression algorithms have response variables that are numerical/quantitative response.
  • Classification algorithms have response variables that are categorical (take values from a discrete set of categories such as TRUE or FALSE).

8.2.4 Parametric or Non-Parametric

  • Parametric: we assume there is a “nice” mathematical relationship between the variables. It could be linear or non-linear. Then we can estimate the parameters in our model so we can predict on new data.

  • These algorithms often allow us to make statistical tests about our results.

  • The closer our assumed relationship is to the “true but unknown” relationship, the more likely we will have good predictions.

  • Non-Parametric: We don’t make any assumptions about the form of the relationship.

    • We still create parameters but they don’t have any known statistical properties.
    • Non-parametric models can create more more flexible solutions, but we have to use other other methods (and run them many times) to quantify the uncertainty (accuracy) of our results.

8.3 Flexible or Restrictive?

A key concept in SML is choosing how flexible or non-flexible (restrictive) a model is by tuning the number of parameters (degrees of freedom) available for fitting the model.

  • Flexible models have more parameters (or degrees of freedom) so they can more closely match the input data.
    • Highly flexible models, with hundreds (billions) of parameters, can be complicated to interpret.
    • These are “blackbox” models - since we can’t explain what is happening inside the model to explain the prediction, e.g., why was someone turned down for a loan.
    • Over-fitting the data occurs when a model is too flexible. It matches sample data so closely its predictions on new data have high variance. It is modeling the “noise” in addition to the “signal”.
  • Restrictive models have fewer parameters (or degrees of freedom).
    • They can be easier to interpret but usually do not match the data as well.
    • Under-fitting the data occurs when a model is too restrictive so it misses key features of the function \(f\) and its predictions on new data have high bias.

Think of degrees of freedom (df) as the number of times we can change the shape of the relationship between the predictor variables and the response variable across the range of the predictors.

  • A straight line is inflexible and uses two degrees of freedom (intercept and slope). It has no bends or curves in it.

When we allow more degrees of freedom, we can create a more flexible model.

  • Flexible models follow the data more closely, e.g., adding a squared term allows a linear model to bend to follow the data more closely than a single straight line.
  • A high-degree polynomial (e.g., a spline) can be quite curvy and can be different on different parts of the data.
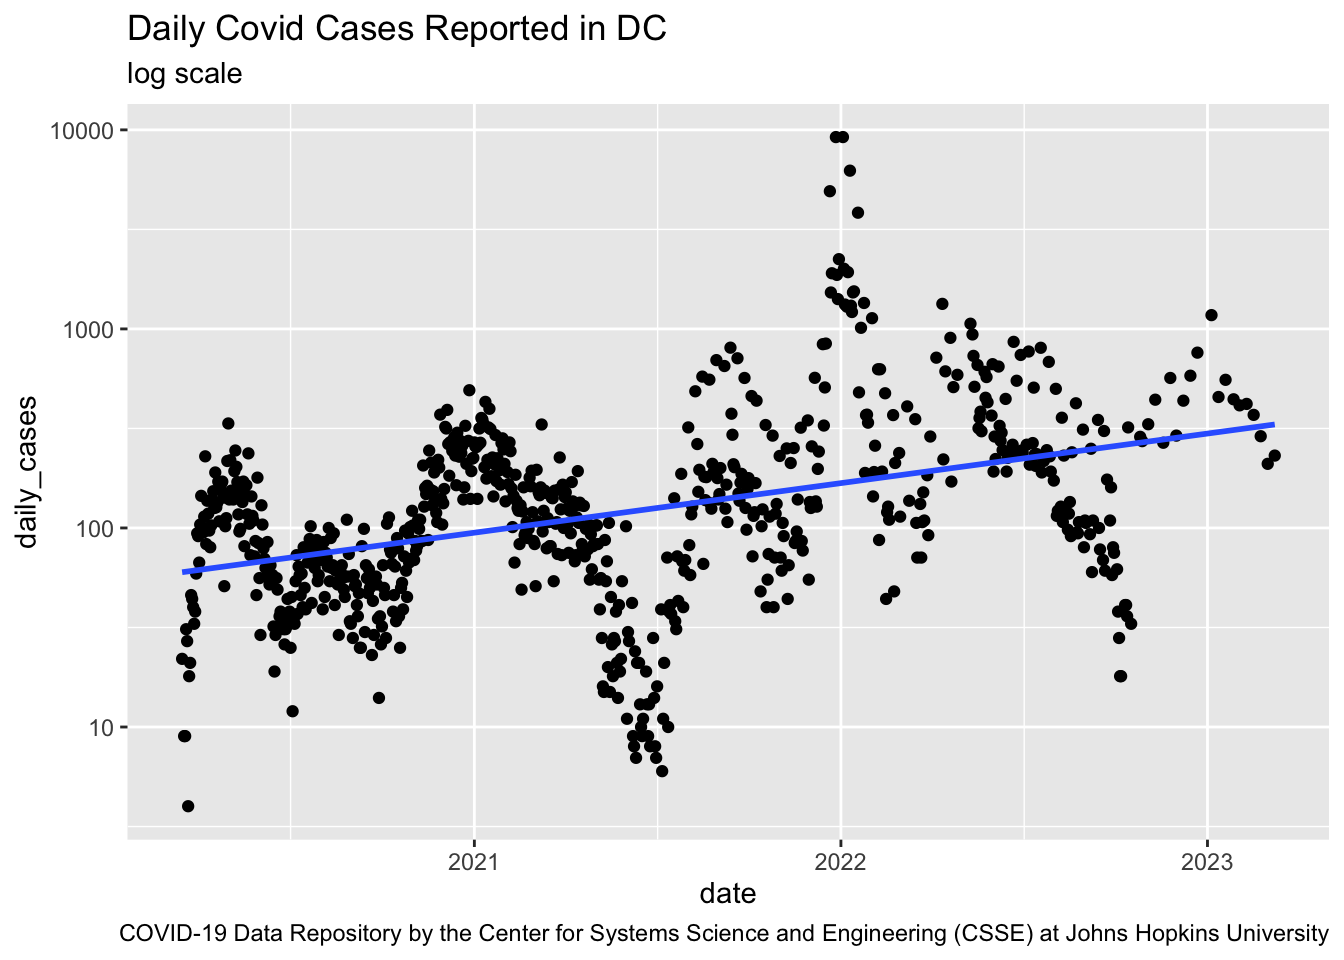
  • As an example, the plot of Covid 19 cases in DC over time in Figure 8.3 is highly non-linear so a linear model would not be a good fit.
Show code
url <- c("https://raw.githubusercontent.com/CSSEGISandData/COVID-19/master/csse_covid_19_data/csse_covid_19_time_series/time_series_covid19_confirmed_US.csv")
readr::read_csv(url) |> 
  dplyr::filter(FIPS == 11001) |> 
  dplyr::select(tidyselect::contains("/")) |> 
  tidyr::pivot_longer(cols = tidyselect::contains("/"), names_to = "date", values_to = "cases", names_transform = lubridate::mdy) |> 
  dplyr::mutate(daily_cases = cases - dplyr::lag(cases)) |> 
  dplyr::filter(daily_cases != 0) ->
  covid_19_dc
rm(url)
covid_19_dc |> 
  ggplot2::ggplot(ggplot2::aes(date, daily_cases)) +
  ggplot2::geom_point() +
  ggplot2::geom_smooth(se = FALSE, method = lm, formula = y ~ x) +
  ggplot2::scale_y_log10() +
  ggplot2::labs(title = "Daily Covid Cases Reported in DC",
                subtitle = "log scale",
       caption = "COVID-19 Data Repository by the Center for Systems Science and Engineering (CSSE) at Johns Hopkins University") ->
  covid_19_dc_plot
covid_19_dc_plot
A point plot of the daily cases for Covid19 in the US city of  Washington, DC showing the highly nonlinear nature of the data. A linear regression line does not fit the data well at all.
Figure 8.3: Daily Covid19 Cases in Washington DC

Is it good to be flexible?

  • Flexible methods have more parameters (df) and can follow the sample data more closely
  • However, the higher the flexibility, the higher the variance (variability of our predictions) so a too-flexible model may not predict very well on new data.

8.4 Comparing Models

Regardless of our question (inference or prediction), we are usually building multiple models.

SML algorithms have different strengths and weaknesses so we want to try a variety of approaches to building a model.

  • For a regression problem we could try linear regression, polynomial regression, ridge Regression, LASSO Regression, regression Trees (multiple types), principal components regression, neural networks, …
  • For a classification problem we could try logistic regression, SVM, K-nearest Neighbors, Linear Discriminant Analysis/Quadratic Discriminant Analysis (LDA/QDA), classification trees (several types), naive Bayes prediction, neural networks, …

Even with the same approach or algorithm, we still have more choices to make:

  • choosing what variables or “features” to select for use in the model.
  • choosing whether and how to transform the selected variables.
  • choosing “hyper-parameters” to change how the algorithm runs to try to get the best performance, e.g., setting the hyper-parameter for when to stop based on the rate of improvement.

Given all these choices and models, as stated in Section 8.2, we need to quantitatively measure model performance.

There are a variety of metrics we can use but we want to compare models based on how well the model performs on new data, i.e., on a test data set.

  • We want to avoid comparing models on their performance on the training data.
Warning

ML models tend to overfit to the training data. As we shall see, overfitting can lead to poor performance on new data.

  • Overfitting is akin to “memorizing’ the training data or”learning” the noise in the data.

Thus, metrics for predictive error are commonly used when comparing models.

  • For Regression Models, that means using Mean Squared Error (MSE) for predictions from the test data.
  • For Classification Models, that means using Classification Error rates for predictions from the test data.

While these provide a good start, there are other considerations at play as well.

  • A key one is the risk analysis for the predictions. It is often true that the risk is different for different kinds of errors.
  • If you are legally required to be able to explain the model results, you may have to forgo better performing “black box” models.
  • If you are more concerned about how the model will perform on a variety of new data for prediction, you may be willing trade off some bias for reduced variance.
Important

As Figure 8.1 suggests, we are on a quest to find a model that is useful in answering our question.

Machine’s can learn, but Humans still have to decide what is useful to them.

8.5 Using Mean Squared Error (MSE) as a Measure of Performance for Regression

Prediction error is the flip side of prediction accuracy – How well can a model predict the unknown.

If a model has high variance, there is a lot of noise in the predictions; change the data a little and the predictions can change a lot.

Regression model performance is often measured by prediction mean squared error (MSE) where the predictions are on test data, i.e., data Not used to train the model.

  • To calculate a model’s MSE, (read the name from right to left).
    • Make a prediction for each of the test data points.
    • Subtract the prediction from the “true” known response value (that is the error).
    • Square each error (multiply it by itself)
    • Calculate the mean (average) across all the squared errors.
    • Now you have the MSE.

We could do some math to show MSE can be broken into three parts that add up to create the total MSE.

  • These are the reasons our predictions could be wrong.
  1. The Variance of our Response variable - This is “Irreducible” error as we can’t do anything about it.
  • The more scattered our response variable is, the higher the model’s MSE no matter how good the model is.
  • If we are predicting weight based on height, there are a lot of factors that influence weight besides height. Thus we will have some error based on the fact we are using a model that is a subset or abstraction of reality. Life is messy.
  1. The Squared Bias of our predictions - sometimes called “systematic error”.
  • How far are are our predictions from the true values on average (then squared).
    • Squaring penalizes predictions that are much farther away from the true value more than those that are close.
  • This can happen if we have too simple of a model, too restrictive.
  • If we try to model weight based on height as a straight line, but it should be a curve, we will consistently under or over- predict the true value.
  • We can reduce it by increasing the flexibility of our model and we want it to be small.
    • If our expected bias is 0, we say our estimates are “unbiased” which is a good thing.
  • High bias means our model is wrong in the same way over and over again.
  1. The Variance of our predicted values - sometimes called “model sensitivity to new data”.
  • How scattered are our predictions as we train the model on new data.
  • This can happen when we fit the model too tightly or closely to one set of data (the training data) so given a new training data set it does poorly on the new data.
  • Let’s say we built a model that accurately predicted weight for one group of people, and then trained it in the same way on a second group with similar but different heights. If the predictions for people with similar heights but in the different groups are vastly different, that means the model has high variance in its predictions.
  • We can reduce it by decreasing the flexibility of our model and we want it to be small.
  • High variance means our model is too sensitive to the noise in the data.
Important
  • Flexible Methods have low bias as they can follow the data but can have high variance.
  • Restrictive Methods have low variance and but may have high bias as they may not match all the data well.
  • This need to balance bias and variance in predictions is why SML is not just “plug and chug”– we have to think.

8.6 Choosing How Much Flexibility is “Best” for a Model

We will use the Auto data set from the American Statistical Association’s Exposition of 1983 (ASA 1983) to see how we can compare different levels of flexibility and choose a model.

8.6.1 Get the Data and Plot the Variables of Interest.

Let’s load the {tidyverse}, read in the data, and glimpse() it.

Show code
library(tidyverse)
Auto <- read_csv("./data/Auto.csv")
glimpse(Auto)
Rows: 392
Columns: 9
$ mpg          <dbl> 18, 15, 18, 16, 17, 15, 14, 14, 14, 15, 15, 14, 15, 14, 2…
$ cylinders    <dbl> 8, 8, 8, 8, 8, 8, 8, 8, 8, 8, 8, 8, 8, 8, 4, 6, 6, 6, 4, …
$ displacement <dbl> 307, 350, 318, 304, 302, 429, 454, 440, 455, 390, 383, 34…
$ horsepower   <dbl> 130, 165, 150, 150, 140, 198, 220, 215, 225, 190, 170, 16…
$ weight       <dbl> 3504, 3693, 3436, 3433, 3449, 4341, 4354, 4312, 4425, 385…
$ acceleration <dbl> 12.0, 11.5, 11.0, 12.0, 10.5, 10.0, 9.0, 8.5, 10.0, 8.5, …
$ year         <dbl> 70, 70, 70, 70, 70, 70, 70, 70, 70, 70, 70, 70, 70, 70, 7…
$ origin       <dbl> 1, 1, 1, 1, 1, 1, 1, 1, 1, 1, 1, 1, 1, 1, 3, 1, 1, 1, 3, …
$ name         <chr> "chevrolet chevelle malibu", "buick skylark 320", "plymou…
We are interested in the relationship between weight and mpg (miles per gallon).

Let’s create a scatterplot with weight on the x axis and mpg on the y axis.

  • Use alpha = .5 to reduce the overplotting.
  • Assign the name base_plot to the plot and show it.
Show code
ggplot(Auto, aes(x = weight, y = mpg)) +
  geom_point(alpha = .5) ->
base_plot
base_plot

  • It does not look quite linear.

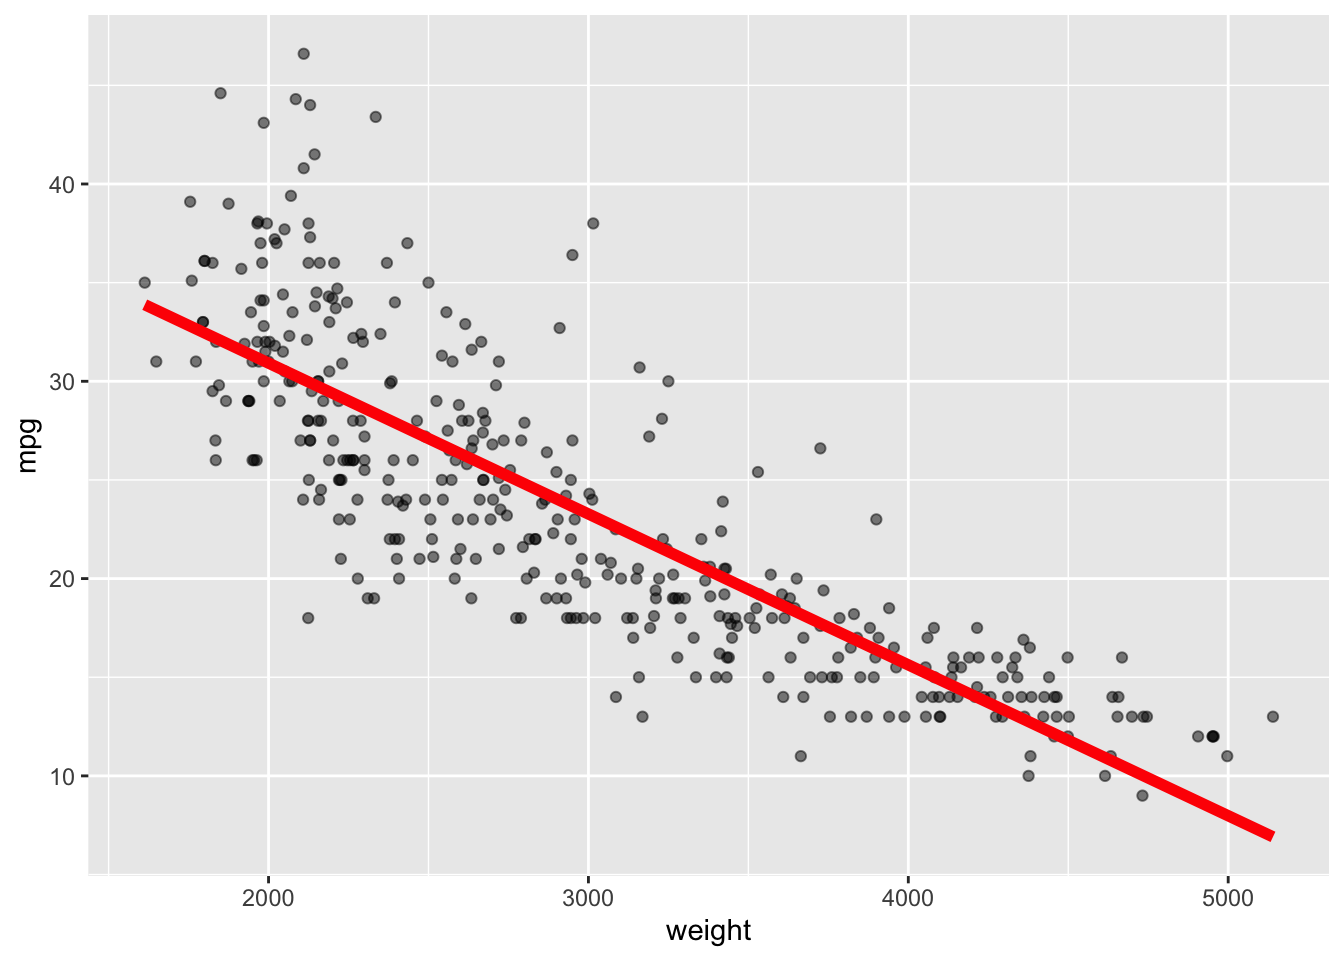
Start with the base_plot and use geom_smooth() to add a Linear Regression Line as in Figure 8.4.

  • Save as base_plot and show it.
base_plot +
  geom_smooth(method = lm, se = FALSE, col = "red", linewidth  = 2) ->
base_plot
base_plot
Figure 8.4: A plot of mpg vs weight with a linear smoother
  • Points seem to be more above the lines on the extremes and below the line in the middle (high bias).

8.6.2 Calculate the Prediction MSE

To calculate the Prediction MSE, we need test data so we will split the data into halves, training and testing data sets.

  • To create a 50/50 split, we will get a random sample of size \(n/2\) where \(n\) is the number of observations.
  • We can use that sample as a vector of indexes to subset the data set.
  • We will also set the seed for the pseudo-random number generator so our split of the observations is repeatable.
n <-  length(Auto$mpg)
n
[1] 392
set.seed(1234)
z <-  sample(n, n/2) # drawn from integers 1:n

Use the lm() function to create a regression model based on the training data subset using the indices in z.

reg <-  lm(mpg ~ weight, subset = z, data = Auto)

Use the testing data with predict() to generate the predictions from the new data.

Y <-  Auto$mpg[-z] # the True Y
Yhat <-  predict(reg, newdata = Auto[-z,]) # The predicted Y

Now, calculate the prediction MSE by calculating the differences between the vectors of \(Y\) and \(\hat{Y}\), squaring the differences, and then using the mean() function to get the average.

MSE <- mean((Y - Yhat)^2)
MSE
[1] 17.25805
  • This number does not mean much by itself. The MSE is only meaningful when comparing to the MSE from other models.
  • Perhaps we can get a lower MSE then 17.25805 with a different model.

The original plot in Figure 8.4 suggested the relationship was not linear. Since linear regression is a restrictive model it is probably not representing the data very well.

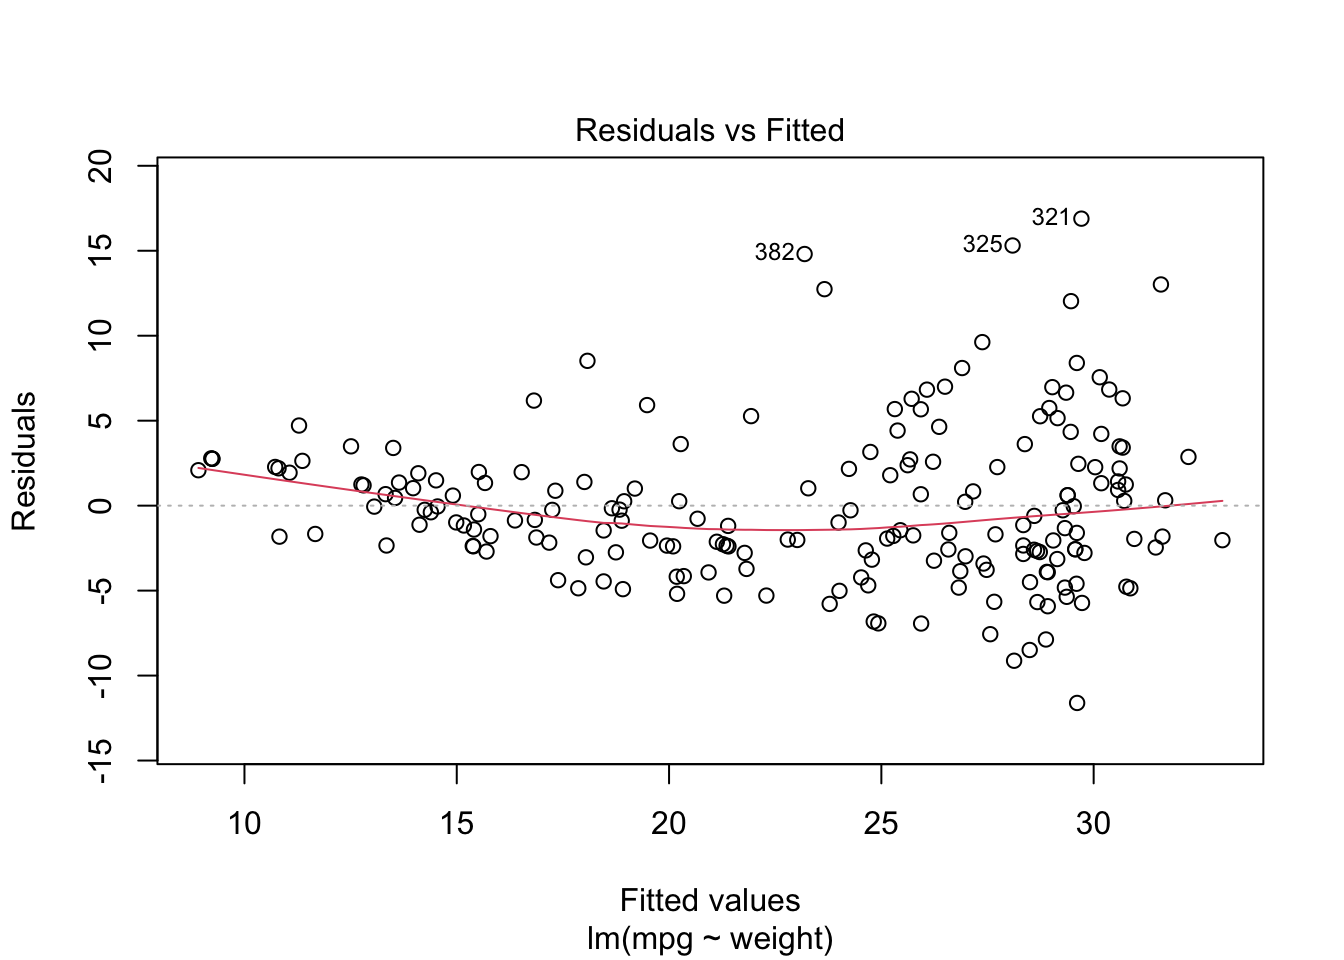
Let’s use a plot of the residuals versus fitted values commonly used in regression analysis.

  • If the “true” relationship is linear, and the linear model is a good fit, we would expect to see the residuals generally evenly-spaced both above and below the line across the range of the values.

  • Use Base R plot() to produce a quick plot of the Residuals (errors) vs the Fitted values.

plot(reg, which = 1)
Figure 8.5: A plot of the residuals versus the fitted values (the regression line)
  • Figure 8.5 shows there is clear curvature to the residuals as they are not evenly spaced above and below the line.
  • The linear model is not a good fit

8.6.3 Let’s Try a Spline Model which can be Flexible.

Spline models allow us to adjust the number of degrees of freedom or parameters in the model to provide more flexibility.

  • This makes df a hyper-parameter we can use later to tune our model.

Let’s start with df = 2. This is the same as simple linear regression with two parameters for intercept and slope.

We will use the geom_spline() plotting function from the {ggformula} package.

  • Start with base_plot and add the spline on top (in the next layer). Note the df=2 argument.
  • Save as base_plot2 and show it.
library(ggformula) # the package for geom_spline

base_plot +
geom_spline(df = 2, color = "orange", lty = 2, linewidth = 2) ->
  base_plot2
base_plot2

  • Notice how the linear regression line and the spline are exactly the same.

Let’s increase the degrees of freedom which allows for more flexibility.

  • Use df = 3, then 10, then 40, and then 140.
  • This does not mean the spline is fitting only higher-order polynomials. It may decide to split into different polynomials for different parts of the data.
base_plot +
  geom_spline(df = 2, color = "orange", lty = 2) +
  geom_spline(df = 3, color = "blue",  linewidth = 2) +
  geom_spline(df = 10, color = "brown", linewidth = 2) +
  geom_spline(df = 40, color = "green", linewidth = 2) +
  geom_spline(df = 140, color = "purple", linewidth = 1) 

  • As the degrees of freedom increase, the line is more flexible and matches the data better, but the model might be less accurate for prediction as the bias decreases but the variance increases.

8.7 Using Test MSE to Explore Tuning a Model

We want to compare the prediction MSE across various versions of a regression model.

We created multiple spline models where each had a different degrees of freedom.

The question is which was best? Can we optimize the model for the degrees of freedom that minimizes MSE.

As we saw in Section 8.5, MSE has two elements that are reducible - the Squared Bias and the Variance of the predictions. We can’t do anything about the irreducible error.

Important

To minimize the MSE we have to find the balance between minimizing the variance of the estimates and the bias of the estimates.

This step in tuning the model is known as The Bias-Variance Trade-off.

8.7.1 Tuning an SML model

Tuning is optimization of a SML to minimize the predictive error – typically finding the optimal level of flexibility.

Let’s go back to the Auto data. Recall the Figure 8.4 with regression line of mpg vs weight.

base_plot

The plot suggests linear regression tends to underestimate mpg for the light and heavy cars and overestimate the mid-size cars.

When we add a highly flexible spline model (df = 100), it is much closer to the data but the accuracy of the predictions appear to be highly dependent upon the value of weight.

base_plot +
  geom_spline(df = 100, color = "purple")

Let’s try to tune our model.

Step one is create training and test data. Instead of splitting 50-50, let’s pick 200 cars for our training set out of 392 observations.

set.seed(123)
z <-  sample(nrow(Auto),200)
training <-  Auto[z,]
test <-  Auto[-z,] # the complement of the indices for the training data

8.7.2 Fit a Regression Model

Let’s use the lm() function to fit a regression model on the training data and check the summary.

reg <- lm(mpg ~ weight, data = training)
summary(reg)

Call:
lm(formula = mpg ~ weight, data = training)

Residuals:
    Min      1Q  Median      3Q     Max 
-9.0822 -2.7920 -0.4653  2.2020 16.4458 

Coefficients:
              Estimate Std. Error t value Pr(>|t|)    
(Intercept) 46.2373794  1.1255991   41.08   <2e-16 ***
weight      -0.0076223  0.0003641  -20.93   <2e-16 ***
---
Signif. codes:  0 '***' 0.001 '**' 0.01 '*' 0.05 '.' 0.1 ' ' 1

Residual standard error: 4.481 on 198 degrees of freedom
Multiple R-squared:  0.6888,    Adjusted R-squared:  0.6872 
F-statistic: 438.2 on 1 and 198 DF,  p-value: < 2.2e-16

Note the df is \(198 = 200 - 2 \text{ parameters}\).

We will use this model to make our predictions. We can predict for the entire data set and then select the -Z indexed values to calculate \(MSE_{test}\)

Yhat <-  predict(reg, newdata = Auto)
MSE_test <-  mean((Yhat[-z] - Auto$mpg[-z])^2)
MSE_test
[1] 17.44414

What’s the unit of measure for MSE_test? – It’s miles-squared per gallons-squared – a bit hard to interpret.

What can we do? – take the square root to give us the Root Mean Squared Error (RMSE).

RMSE_reg <- sqrt(MSE_test)
RMSE_reg
[1] 4.176619

So the liner regression model is predicting within \(\pm\) 4.1766186

We could add more more variables from the data set, besides weight, which would make the model more flexible. How do we know if it makes it too flexible?

8.7.3 Fit a more flexible spline model instead

Use the smooth.spline() function from the Base R {stats} package ti generate the spline model.

ss <-  smooth.spline(Auto$weight[z], Auto$mpg[z], df = 100)

Use predict() to make the predictions.

  • Note predict() returns a list of x and y. All we want is the y element.
Yhat <- predict(ss, Auto$weight[-z])
str(Yhat)
List of 2
 $ x: num [1:192] 3504 3693 3436 4341 4312 ...
 $ y: num [1:192] 18.3 22.2 16.1 15.4 13.9 ...
Yhat <- predict(ss, Auto$weight[-z])$y

Get the RSME and compare to RMSE_Reg

RMSE_ss <- sqrt(mean((Yhat - Auto$mpg[-z])^2))
RMSE_ss
[1] 6.205467
RMSE_reg
[1] 4.176619
Note

Building spline models allow for fractional degrees of freedom as long as \(df \geq 1\). Hard to imagine in our minds, but mathematically fine.

Let’s use this to see if we can find an optimal value for our RMSE.

8.7.4 Fitting Many Models

Let’s fit 100 spline models with different degrees of freedom

  • We will use a random sample of 200 rows for training and the rest for test.
  • We will use the map_dbl() function from {purrr} which allows us to pass it a vector of degrees of freedom and a function name. It will use the function to calculate the RMSE for each degree of freedom in the vector and return all the results as a numeric vector.
set.seed(123)
z <-  sample(nrow(Auto), 200)
deg_free <- seq(1.1, 11, .1) # create a sequence of numbers for the df

# Create a custom function to calculate RMSE (I want to use it several times)
calc_rmse_spline <- function(x, y, index, df){
  ss <-  smooth.spline(x = x[index], y = y[index], df = df)
  Yhat <-  predict(ss, x = x[-index])$y
  RMSE <- sqrt(mean((Yhat - y[-index])^2))
}

# we are using the anonymous function syntax \(arg) with argument df
# 
RMSE <- map_dbl(deg_free, \(df) calc_rmse_spline(Auto$weight, Auto$mpg, z, df)) 

Let’s plot how the RMSE changes with degrees of freedom.

Show code
ggplot(bind_cols(deg_free = deg_free, RMSE = RMSE), aes(deg_free, RMSE)) + # add the vectors as columns into a data frame.
  geom_point() +
  geom_point(aes(x = deg_free[(RMSE == min(RMSE))], y = min(RMSE)), color = "red") + 
  geom_text(aes(x = deg_free[(RMSE == min(RMSE))], y = min(RMSE)), label = (deg_free[(RMSE == min(RMSE))]), nudge_y = -.006,check_overlap = TRUE) + 
  geom_vline(xintercept = 2, color = "blue", lty = 2) +
  geom_text(aes(x = 1.4, y = 4.1), label = "Too Rigid\nHigh Bias\nUnderfit") +
  geom_text(aes(x = 6, y = 4.1), label = "Too Flexible\nHigh Variance\nOverfit") 

What happens if we change the seed for selecting our sample? What happens if we change our sample size?

Try the shiny app for Exploring Splines with the Auto Data.

Important

Selecting the hyper-parameter(s) to create a model that optimizes the bias variance trade-off is a typical challenge in Data Science.

8.7.5 DC Covid Data Example Continued

Recall Figure 8.3?

Show code
covid_19_dc_plot

How many splines are optimal??

Let’s get the data for DC and shape it for our analysis.

url <- c("https://raw.githubusercontent.com/CSSEGISandData/COVID-19/master/csse_covid_19_data/csse_covid_19_time_series/time_series_covid19_confirmed_US.csv")
readr::read_csv(url) |> 
  dplyr::filter(FIPS == 11001) |>   # Get just data for Washington DC
  dplyr::select(tidyselect::contains("/")) |> 
  tidyr::pivot_longer(cols = tidyselect::contains("/"), 
                      names_to = "date", values_to = "cases", 
                      names_transform = lubridate::mdy) |> 
  # Subtract totals for successive days to get new daily cases
  dplyr::mutate(daily_cases = cases - dplyr::lag(cases)) |>  
  dplyr::filter(daily_cases != 0) ->
  covid_19_dc
rm(url)

Let’s calculate the RMSE for all the possible Degrees of Freedom

set.seed(1234)
z <-  sample(nrow(covid_19_dc),floor(nrow(covid_19_dc)*.6))
deg_free <- seq(2, 100, 1)

RMSE <- map_dbl(deg_free, 
                \(df) calc_rmse_spline(as.integer(covid_19_dc$date),
                                       covid_19_dc$daily_cases, z, df))
Show code
ggplot(bind_cols(deg_free = deg_free, RMSE = RMSE), aes(deg_free, RMSE)) +
  geom_point() +
  geom_point(aes(x = deg_free[(RMSE == min(RMSE))], y = min(RMSE)),
             color = "red") +
  geom_text(aes(x = deg_free[(RMSE == min(RMSE))], y = min(RMSE)),
            label = (deg_free[(RMSE == min(RMSE))]), nudge_y = -4,
            check_overlap = TRUE) +
  geom_vline(xintercept = 2, color = "blue", lty = 2)

Show code
covid_19_dc_plot +
  geom_spline(df = 18, color = "yellow", linewidth = 2) +
  geom_spline(df = 50, color = "green", linewidth = 2) +
  geom_spline(df = 72, color = "red", linewidth = 1) +
  geom_text(aes(x = lubridate::mdy("07/05/2020"), y = 1250), label = "df = 18", 
            color = "yellow") +
  geom_text(aes(x = lubridate::mdy("07/05/2020"), y = 750), label = "df = 50", 
            color = "green") +
  geom_text(aes(x = lubridate::mdy("07/05/2020"), y = 500), label = "df = 72", 
            color = "red") 

What does this suggest to you?

8.8 Classification Prediction Error

Concepts such as bias-variance trade-off and optimizing flexibility to minimize prediction error are applicable in classification models, but the formulas are different than in regression.

  • We can’t calculate differences between two categories, e.g., if we were predicting hair color, \(brown - red\) does not mean anything, so we just determine if the prediction is correct or incorrect - and call an incorrect prediction an error.

The error rate is the fraction or proportion of incorrect classifications.

  • The training error rate is the proportion of predictions based on the training data that are incorrect or misclassified.
  • What we will use to compare models is the proportion of misclassifications based on new data (test data not used in creating the model) or the test terror rate.

We want to optimize our classifier by minimizing the test error rate.

  • Note: the error rate is a percentage so the \(\text{accuracy rate} = 1 - \text{error rate}\).
    • An error rate of 20% means the accuracy rate is 80%.
  • Minimizing the error rate is the same as maximizing the accuracy rate.
Important

Optimizing SML models to be useful means humans making choices about the bias-variance trade off.

8.9 Regularization

Regularization is a family of methods used to improve model performance.

Think of regularization as a set of tools to keep a model from getting carried away.

  • It’s a way to control the complexity of a model so it doesn’t just memorize the data (overfitting) but actually learns patterns that generalize well to new data.

Regularization is like saying to your model: “Hey, don’t try to be perfect — just be reasonable.”

Without regularization, a model — especially complex ones like deep neural networks or models with lots of features — might:

  • Fit the noise in the data (like trying to explain randomness).

  • Depend too heavily on certain input variables.

  • Become so complicated that it’s unstable and unpredictable.

  • Methods exist to help mitigate the risk of overfitting by selecting the right variables, and reduce variance of our predictions by “shrinking” our coefficient estimates.

When we have a lot of variables to choose from in building a model, how do we know which ones to use? Why not use them all?

8.9.1 Every Variable Costs a Degree of Freedom

Every variable we include in the model adds a degree of freedom for the model making it more flexible

  • That also increases the risk of overfitting, capturing noise rather than the true signal.

There is an associated cost as well, especially in linear models.

  • The total degrees of freedom are determined by the number of observations, \(n\).
  • Each predictor we add uses up one degree of freedom.
  • For small to moderate sample sizes (e.g., in the hundreds), this trade-off becomes important.

Why does it matter?

The variance of the coefficient estimates increases as residual degrees of freedom decrease:

  • That means: fewer df for residuals \(\implies\) noisier estimates of the model coefficients.
  • Noisier estimates \(\implies\) higher variance in predictions \(\implies\) poorer generalization to new data.

8.9.2 More Variables Means More Chance of Multicollinearity

One of the statistical assumptions in linear regression is that our predictor variables are “statistically independent” of each other, i.e.,knowing the value of one variable tells us nothing about the value of another.

  • We know that assumption is not really 100% true in the real world.
  • Our models are general robust to small correlations among variables.
  • However, when two or more variables are highly correlated, trouble can arise with our models and their predictions.

Multicollinearity in statistics is a fancy term for when two or more variables are highly correlated with each other.

  • When this happens, it means that they are both trying to provide the same information to the model.
  • This makes the model unstable as small shifts in the data may tilt the model in different directions towards one variable versus the other.
  • It also increases the variance of the estimates of the variables’ coefficients.

One measure is called the Variance Inflation Factor (VIF). This a measure of how much a variable will inflate or increase the variance of other variables in the model due to bing multicollinearity with them.

It is useful for identifying which variables might be removed from the model.

Let’s use the Auto.csv data.

Show code
library(tidyverse)
Auto <- read_csv("./data/Auto.csv")
glimpse(Auto)
Rows: 392
Columns: 9
$ mpg          <dbl> 18, 15, 18, 16, 17, 15, 14, 14, 14, 15, 15, 14, 15, 14, 2…
$ cylinders    <dbl> 8, 8, 8, 8, 8, 8, 8, 8, 8, 8, 8, 8, 8, 8, 4, 6, 6, 6, 4, …
$ displacement <dbl> 307, 350, 318, 304, 302, 429, 454, 440, 455, 390, 383, 34…
$ horsepower   <dbl> 130, 165, 150, 150, 140, 198, 220, 215, 225, 190, 170, 16…
$ weight       <dbl> 3504, 3693, 3436, 3433, 3449, 4341, 4354, 4312, 4425, 385…
$ acceleration <dbl> 12.0, 11.5, 11.0, 12.0, 10.5, 10.0, 9.0, 8.5, 10.0, 8.5, …
$ year         <dbl> 70, 70, 70, 70, 70, 70, 70, 70, 70, 70, 70, 70, 70, 70, 7…
$ origin       <dbl> 1, 1, 1, 1, 1, 1, 1, 1, 1, 1, 1, 1, 1, 1, 3, 1, 1, 1, 3, …
$ name         <chr> "chevrolet chevelle malibu", "buick skylark 320", "plymou…
Let’s predict mpg based on the other variables not including name.

reg <- lm(mpg ~ . - name, data = Auto)

We can use the {car} package (Companion to Applied Regression) to extract variance inflation factors for the variables. (Fox and Weisberg 2019)

library(car)
vif(reg) |> round(2)
   cylinders displacement   horsepower       weight acceleration         year 
       10.74        21.84         9.94        10.83         2.63         1.24 
      origin 
        1.77 

How to interpret the VIF?

  • Having displacement in the model will inflate the variances of other variables by 21.843.

How was it computed?

  • By regressing displacement on all the other variables (except the response mpg and name which we left out of the model.)
Show code
reg_vif <- lm(displacement ~ . -name - mpg, data = Auto)
summary(reg_vif)

Call:
lm(formula = displacement ~ . - name - mpg, data = Auto)

Residuals:
    Min      1Q  Median      3Q     Max 
-74.429 -12.546   0.438  13.041 103.012 

Coefficients:
              Estimate Std. Error t value Pr(>|t|)    
(Intercept)  -43.88383   31.41652  -1.397   0.1633    
cylinders     28.54918    1.63999  17.408  < 2e-16 ***
horsepower     0.53804    0.08939   6.019 4.09e-09 ***
weight         0.03347    0.00408   8.204 3.54e-15 ***
acceleration  -1.34481    0.66682  -2.017   0.0444 *  
year          -0.45258    0.34491  -1.312   0.1902    
origin       -11.73431    1.78891  -6.559 1.74e-10 ***
---
Signif. codes:  0 '***' 0.001 '**' 0.01 '*' 0.05 '.' 0.1 ' ' 1

Residual standard error: 22.57 on 385 degrees of freedom
Multiple R-squared:  0.9542,    Adjusted R-squared:  0.9535 
F-statistic:  1337 on 6 and 385 DF,  p-value: < 2.2e-16

We can calculate the VIF of displacement as

1/(1 - summary(reg_vif)$r.squared)
[1] 21.83679

The VIF shows how well displacement could be predicted by the other variables in the data. While not perfect correlation, it is pretty high.

Let’s check the house_ed_gdp_df.

house_ed_gdp_df <- read_csv("./data/house_ed_gdp_joined.csv")
names(house_ed_gdp_df)
 [1] "Municipality"               "culture_site"              
 [3] "Average_size"               "has_washing_machine"       
 [5] "has_internet"               "has_computer"              
 [7] "has_car"                    "Illiteracy_rate"           
 [9] "primary_lower_secondary"    "upper_secondary"           
[11] "university"                 "population"                
[13] "general_revenue_per_person"
  • Regress general_revenue_per_person on all the variables but Municipality and check the VIF.
grp_reg <- lm(general_revenue_per_person ~ . -Municipality, data = house_ed_gdp_df)
vif(grp_reg) |> round(2)
           culture_site            Average_size     has_washing_machine 
                   2.01                    1.62                    1.84 
           has_internet            has_computer                 has_car 
                   3.01                    6.16                    2.37 
        Illiteracy_rate primary_lower_secondary         upper_secondary 
                   2.72                 1548.76                  437.86 
             university              population 
                 578.91                    2.37 
  • Are the results surprising? How do you interpret it?

  • What should we do?

Show code
grp_reg2 <- lm(general_revenue_per_person ~ . -Municipality - primary_lower_secondary - upper_secondary, data = house_ed_gdp_df)
vif(grp_reg2) |> round(2)
       culture_site        Average_size has_washing_machine        has_internet 
               1.85                1.58                1.68                2.44 
       has_computer             has_car     Illiteracy_rate          university 
               5.94                2.28                1.76                4.05 
         population 
               2.34 
  • These are much more reasonable.

Compare the summaries and note how the estimates have changed and the university standard error is much smaller.

summary(grp_reg)

Call:
lm(formula = general_revenue_per_person ~ . - Municipality, data = house_ed_gdp_df)

Residuals:
   Min     1Q Median     3Q    Max 
-21748  -7871  -1651   3947  63262 

Coefficients:
                          Estimate Std. Error t value Pr(>|t|)  
(Intercept)             -2.914e+05  9.498e+05  -0.307   0.7604  
culture_siteno_site      1.873e+03  6.823e+03   0.274   0.7849  
Average_size            -4.895e+03  4.896e+03  -1.000   0.3225  
has_washing_machine      8.897e+01  1.083e+03   0.082   0.9349  
has_internet            -4.064e+02  2.187e+02  -1.858   0.0694 .
has_computer             5.099e+02  6.546e+02   0.779   0.4399  
has_car                 -2.520e+01  3.310e+02  -0.076   0.9396  
Illiteracy_rate          2.142e+03  3.060e+03   0.700   0.4874  
primary_lower_secondary  3.359e+03  9.513e+03   0.353   0.7256  
upper_secondary          3.545e+03  9.571e+03   0.370   0.7127  
university               3.527e+03  9.398e+03   0.375   0.7091  
population              -2.485e-02  3.867e-02  -0.643   0.5236  
---
Signif. codes:  0 '***' 0.001 '**' 0.01 '*' 0.05 '.' 0.1 ' ' 1

Residual standard error: 15330 on 47 degrees of freedom
  (2 observations deleted due to missingness)
Multiple R-squared:  0.2599,    Adjusted R-squared:  0.08674 
F-statistic: 1.501 on 11 and 47 DF,  p-value: 0.1632
summary(grp_reg2)

Call:
lm(formula = general_revenue_per_person ~ . - Municipality - 
    primary_lower_secondary - upper_secondary, data = house_ed_gdp_df)

Residuals:
   Min     1Q Median     3Q    Max 
-20511  -7482  -1912   3244  64321 

Coefficients:
                      Estimate Std. Error t value Pr(>|t|)  
(Intercept)          5.563e+04  9.950e+04   0.559   0.5786  
culture_siteno_site  1.500e+03  6.431e+03   0.233   0.8166  
Average_size        -4.570e+03  4.743e+03  -0.963   0.3400  
has_washing_machine  1.841e+01  1.017e+03   0.018   0.9856  
has_internet        -4.332e+02  1.930e+02  -2.244   0.0294 *
has_computer         4.634e+02  6.307e+02   0.735   0.4660  
has_car              4.674e-01  3.186e+02   0.001   0.9988  
Illiteracy_rate      1.462e+03  2.417e+03   0.605   0.5482  
university           3.050e+02  7.709e+02   0.396   0.6941  
population          -2.498e-02  3.770e-02  -0.663   0.5107  
---
Signif. codes:  0 '***' 0.001 '**' 0.01 '*' 0.05 '.' 0.1 ' ' 1

Residual standard error: 15050 on 49 degrees of freedom
  (2 observations deleted due to missingness)
Multiple R-squared:  0.2571,    Adjusted R-squared:  0.1207 
F-statistic: 1.884 on 9 and 49 DF,  p-value: 0.07665
Note

A VIF of 4 is generally considered okay.

  • 5-10 should be noted, and
  • \(\text{VIF} \geq 10\) should be avoided.

The VIF is one method for humans making choices about what variables to include/exclude in a model.

8.9.3 Correlation Plots

Correlation plots provide some insights into how variables might be correlated with each other.

The {corrplot} package has a nice visualization.

  • Limit to numeric variables and no need to include the response.
cor_matrix <- cor(house_ed_gdp_df[, 3:12], use = "complete.obs")  # handles missing values
corrplot::corrplot(cor_matrix, method = "circle", type = "upper", tl.cex = 0.8)

  • Note the large dark red circles on primary_lower_secondary indicating high negative correlation with upper_secondary and university

8.9.4 Comparing Models for Variable Selection

Another method for selecting variables in regression is to build two models, a full and a reduced model.

  • The Reduced model has one or more variables of interest.
  • The Full model has all the variables in the Reduced model plus one or more additional variables.
    • The Reduced model is “nested” inside the Full model.

Then run a regression on the full model and one on the reduced model.

  • In this situation, the Full model’s Residual Sum of Squares must be equal to or less than the Residual Sum of Squares of the Reduced model because it is more flexible.

There is a statistical test for linear regression called the F-test that compares nested models based on how much the MSE is reduced by the Full relative to degrees of freedom

The ratio of the reduction in the MSE per df to the Full model MSE is called the F-Statistic.

If the F-Statistic is large, then the Full model is considered significantly better.

  • If the F-statistic is small, then the information in the extra variables was not worth the cost in degrees of freedom so the Reduced model with fewer variables is better

8.9.5 Shrinkage and Variable Selection

We have seen above that we can choose to remove variables from the model. When there are more than a few variables that can be problematic.

  • The good news is there are ways to tweak the algorithms to have them automatically make choices of variables.

Without regularization, a model, especially complex ones like deep neural networks or models with lots of variables, might:

  • Fit the noise in the data trying to explain randomness.
  • Depend too heavily on certain input variables.
  • Become so complicated, it’s unstable and unpredictable.

Two big ideas in algorithmic regularization are shrinkage and variable selection.

8.9.5.1 Shrinkage:

Shrinkage is when you tweak the algorithm to slowly shift the model’s coefficient estimates (or weights in a neural network) closer to zero.

  • The algorithms are usually trying to minimize MSE. Now we make the goal to minimize MSE with the constraint that the sum of the squared coefficients must be \(\leq 1\).
    • The data in these models is pre-processed (cleaned) so it is all “standardized” with mean 0 and standard deviation 1 so the model can focus on the information in the data, not just the magnitude of the values.
  • Imagine you have a model that assigns a coefficient to every variable (e.g., “height is worth +2.3, age is worth –1.7,” etc.). Now force the model to reduce all the coefficients so they sum to one. It will figure out which variables deserve the largest coefficients.
  • This helps prevent the model from becoming overly confident in any single variable.
  • It’s like saying: “You can use these variables, but don’t shout — speak softly.”

A common shrinkage methods is Ridge regression (L2-norm regularization): Shrinks all coefficients a little bit.

  • Used when: you think all variables matter, but none should dominate.

8.9.5.2 Variable Selection:

Variable Selection is when you tweak the algorithm to shift some of the model’s coefficient estimates closer to zero but potentially move other coefficients all the way to 0, effectively removing them from the model.

  • Again the data is standardized to eliminate the effect of the magnitude of the data.

  • The penalty function now uses the constraint that the sum of the absolute value of the coefficients must be \(\leq 1\). This changes the geometry of the constraint so now 0 is possible.

  • It’s like saying: “You’re not pulling your weight — you’re out.” This makes the model simpler and easier to interpret.

A common variable selection method is LASSO (L1 regularization): Shrinks some coefficients and forces some to become exactly zero.

  • Used when you think only some variables really matter, and want to automatically choose the important ones.

There is also a combination of both called Elastic Net regression.

  • Useful when you want the best of both worlds — some shrinkage, some variable selection.
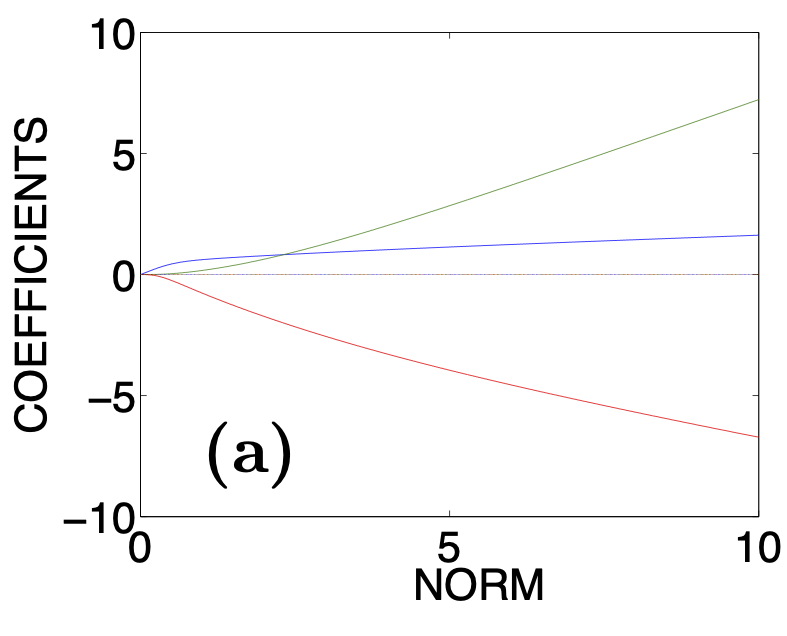
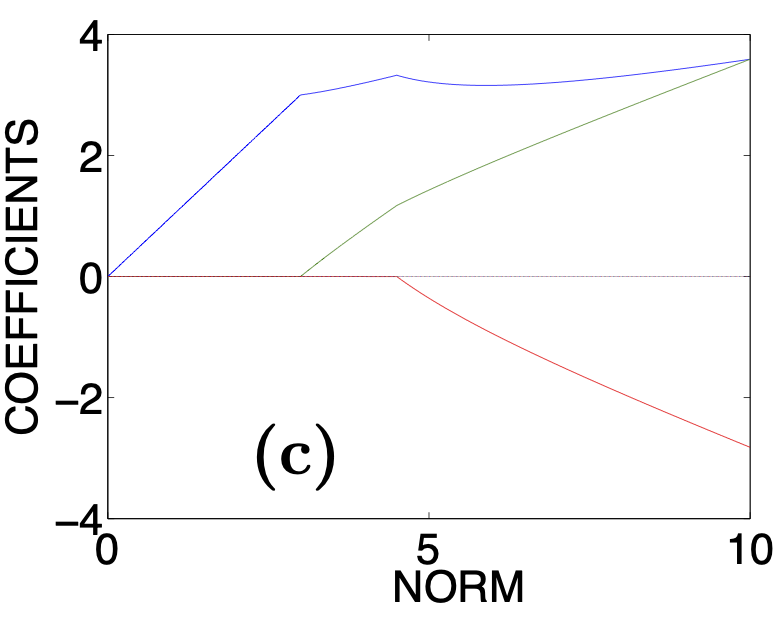
(a) Plot of coefficient values getting close to 0 during Ridge Regression
(b) Plot of coefficient values getting close and going to 0 during LASSO Regression
Figure 8.6: Plots of how the coefficients change as Ridge and LASSO regression algorithms iterate through increasing the penalty (which is equivalent to decreasing the Norm).

8.9.6 Summary

Regularization is like adding a little discipline to your model-building process.

Instead of letting it memorize everything, you guide it toward simpler, more general solutions.

  • Without it, a model might ace the test it trained on but flunk real life.
  • With regularization, you’re teaching it to learn the lesson, not the cheat sheet.