Context
A Project Plan creates a framework for managing the work on the project to meet the requirements on time and within resources. It does not specify how the work will be done.
Framing the project establishes a disciplined foundation for all subsequent technical and project management decisions.
Rather than beginning with tools or methods, effective framing starts by clarifying what problem is being addressed, under what constraints, and according to what standards of evidence and responsibility.
- This process begins with requirements analysis, which identifies stakeholder needs, acceptance criteria, and project constraints.
- It is followed by a review of relevant literature and prior work to understand established methods, performance expectations, and known risks.
- Together, these inputs inform the development of a coherent technical approach that integrates data strategy, methodologies, methods, tools, and workflows.
- Once the technical approach is defined, it must be examined through a Responsible Data Science lens to assess ethical, fairness, privacy, and societal implications.
- Finally, the proposed approach is subjected to a feasibility analysis to ensure it is acceptable, affordable, and deliverable within the project plan.
Taken together, these steps ensure that the project is not only technically sound, but also responsible, realistic, and aligned with stakeholder expectations.
Framing the project can be placed in the context of a higher-level life cycle of project selection and execution, whose results inform the current project’s requirements and constraints.
Most projects start from a germ of an idea, an intuition or inspiration of how one might answer a question, create new knowledge, or solve a known problem.
Before a project can be executed, however, a decision must be made to allocate resources to it.
Because multiple potential projects often compete for the same limited resources, this decision typically involves some level of screening as there could be multiple potential projects vying for the same set of resources.
- For small projects requiring few resources, the screening may be informal and completed quickly.
- For larger projects, requiring substantial resources, the screening process may involve a formal cost-benefit analysis (CBA) or return on investment (ROI) assessment to determine whether the project should be undertaken at all; in some cases, this analysis may itself constitute a separate project.
- The US Defense Advanced Research Projects Agency (DARPA) and many other organizations use a structured approach such as the Heilmeier Catechism as part of their project screening process.
Once the decision has been made to initiate a project, the outcomes of the screening, whether a brief discussion or a detailed CBA, shape the project’s requirements and guidance.
- These are typically formalized in a Performance Work Statement (PWS) or a project description document.
- The decision-making process also typically shapes or constrains the resources and timeline for the project.
The requirements and constraints from those documents inform and guide the work to frame the project.
- Conducting an analysis of the requirements and literature review helps mature and refine the ideas and assumptions from the initial screening into the detailed and feasible technical approach necessary for the project’s success.
When a project concludes, its results inform future potential projects and the projects life cycle rolls on.
References
Requirements Analysis
Introduction
Central Question: How do you analyze a Performance Work Statement (PWS) to determine what’s really required to meet the performance requirements and acceptance criteria?
Data scientists generally possess strong analytical skills and expertise in data wrangling, statistical modeling, machine learning, and data interpretation. When given a new problem, we are eager to jump right into coding to answer the question. However, while the requirements in a (PWS) may be specific, they tend to be “high-level” as they are descriptions of required capabilities or outcomes and not detailed specifications about the code.
Data scientists are often tempted to immediately start coding without thoroughly understanding what they’re actually trying to build. This leads to:
- Scope Creep: Discovering requirements mid-project that change everything
- Technical Debt: Quick hacks that lack robustness and fail as the code expands.
- Requirements Misalignment: Building something that doesn’t meet actual standards or expectations.
- Resource Overruns: Underestimating complexity and having to redo work.
When facing high-level requirements, a best practice is summarized by the maxim “Think before you code”. Taking the time to do an expanded approach to problem analysis and solution design helps ensure you understand what is really meant by the requirements. What are the the specified and implied tasks, any constraints, and the standards for the performance of your solution. This enhanced understanding helps you design your technical approach to meet all the client’s expectations and requirements and then implement your code more efficiently at lower risk.
This expanded approach is often called “Requirements Analysis”.
- Requirements analysis helps avoid the “Jump to Code” problems by forcing systematic thinking about the complete solution before any code is written.
- Requirements analysis provides a framework for a critical professional skill: the systematic interpretation and translation of high-level requirements into actionable and feasible technical approaches for research/analysis or development.
Project Planning and Requirements Analysis are typically parallel and integrated processes. Large projects may have three (or more) teams involved.
- The Project Management team focuses on what work packages must be done, by when, to what level of performance standards to meet the PWS requirements and they project the resource requirements to execute the work within budget.
- The Technical Team focuses on the technical approach, how to execute the work given the projected resources.
- The Quality Assurance (QA) and Test Team focuses on building and executing quality checks and tests to ensure all deliverables meet the PWS quality and performance standards.
No single team is in charge! Each must collaborate with the others to share information so the project solution is feasible, affordable, and acceptable to the client.
When there are conflicts (and there always are), e.g., the technical team wants two additional data scientists and the program management teams says that will cost too much, they generate their analyses and recommendations to the Project Manager who has to decide.
The Good News/ Bad News for this course is you play all four roles: Project Management Team, Technical Team, QA and Test Team, and the Project Manager 😎.
A Systematic Framework for Analyzing High-level Requirements
Projects based on high-level requirements such as in a PWS require systematic interpretation of the requirements to extract both the explicit requirements and hidden assumptions (Implied requirements) that will drive the technical approach.
A systematic framework for requirements analysis answers four questions.
- Specified Tasks: What tasks or requirements are explicit?
- Implied Requirements: What tasks or requirements are implied, i.e, are necessary to accomplish the specified tasks or requirements or are expected by the client, but are not stated?
- Constraints: Are there explicit or implicit factors that limit or shape suitable technical approaches?
- Performance Standards: Are the specified performance standards sufficient for testing and ensuring acceptability?
Specified Tasks
Identifying specified tasks is straightforward. Look for concrete, actionable statements in the PWS that specify what must be accomplished or delivered. Table 4.1 has several examples.
Many PWS documents use the words “shall” or “must” to specify requirements that are legally enforceable.
- There are many tools to search for all the “shall statements” in a PWS and extract them into a Requirements Traceability Matrix to facilitate tracking all the requirements for a project to ensure compliance.
In the Federal Code of Regulations, “shall” and “must” are defined as “imperative” which means they are used in the sense of issuing a command or directive. A “shall statement” creates a mandatory legal obligation that is a legally enforceable requirement.
The use of “will” typically expresses future intention or expectation without the same binding legal force. As an example, in the statement “The contractor shall build system X that will be used by future generations,” the contractor is responsible for building the system, not whether future generations actually use it.
Implied Tasks and Requirements
Specified tasks often have sub tasks that are part of the standard technical approach for performing that task. These are usually derived during the work breakdown analysis.
However, specified requirements can also imply or assume other tasks will be included in the work, as they are necessary to accomplish the high-level requirements, but they are not specified.
- These are often predecessor or parallel tasks.
Table 4.2 includes some possible examples for the tasks from Table 4.1.
Other examples of common implied tasks include:
- Building data scraping tools.
- Integrating with multiple data systems.
- Identifying security and privacy requirements and building in access controls.
- Conducting web accessibility testing.
- Ensuring compliance with regulatory requirements.
- Building scripts or actions to support continuous integration and deployment.
It is good practice to confirm client expectations around implied or assumed tasks, especially if they add significant level of effort, time, or risk to the project.
Identifying Constraints
High-level requirements often specify some constraints but may omit others that clients “assumed” were known. These can affect the the technical approach as well as performance, schedule, and cost projections.
Possible examples include:
Specified Constraints:
- That solution shall operate on hardware and software that is compatible with the organization’s production environments.
- Only use open-source software with specific licenses to allow for proprietary development, e.g., the MIT license.
- Software development shall be done by a team certified as CMMI-level 4.
Implied Constraints:
- Follow organization’s data access permissions and approval processes
- Legacy system integration requirements
Requirements Analysis for Research and Analysis Projects
Research and analysis projects focus on generating insights, testing hypotheses, and building predictive models.
Requirements analysis must identify the analytical complexity, methodological constraints, and validation standards that will drive technical approach decisions.
Critical Requirements Assessment Areas
- Analytical Scope and Complexity
Scope creep is a common risk in projects where requirements have not been well defined or analyzed which leads to a mismatch between the client and the project team about what is “in scope” of the project.
- Resolving this mismatch often leads to the unplanned addition of requirements to the scope of the project.
- Scope creep can result in re-planning, re-working code, schedule delays or budget overruns and ultimately in failed projects and/or dissatisfied clients.
When reviewing the high-level requirements watch out for High-Risk Indicators such as the following:
- Vague success criteria (“provide insights” or “highly accurate”) or acceptance criteria e.g., “user-friendly”
- Multiple stakeholder groups with different expectations or no clear client decision maker.
- “Exploratory” analysis without specifying hypotheses or the number of hypotheses to examine.
- Limited specifications about the scope or currency of the data.
- Requests for “comprehensive” analysis of complex phenomena
Table 4.3 provides an example framework for asking questions to analyze the requirements for a research/analysis project.
- Data and Methodology Constraints
High-Effort/High-Risk Data Scenarios:
- Multiple disparate data sources requiring complex integration
- Unstructured data (text, images, audio) requiring preprocessing
- Sensitive data with privacy/compliance restrictions
- Real-time data streams requiring specialized infrastructure
- Historical data with quality/completeness issues
Methodological Complexity Factors:
- Novel or cutting-edge techniques requiring significant learning time
- Custom algorithm development vs. off-the-shelf solutions
- Ensemble methods or model stacking approaches
- Causal inference techniques requiring specialized expertise
- Large-scale distributed computing requirements
- Validation and Performance Standards
Performance Standard Categories
- Statistical Performance: Accuracy, precision, recall, statistical significance
- Business Performance: ROI impact, decision improvement, process efficiency
- Operational Performance: Processing speed, reliability, maintainability
- Communication Performance: Stakeholder understanding, are they actionable
Critical Assessment Questions:
- Validation Rigor: Academic peer-review standards vs. business validation needs?
- Performance Thresholds: What accuracy levels justify deployment/implementation?
- Interpretability Requirements: Black-box models acceptable or explanation required?
- Uncertainty Communication: How will confidence intervals/limitations be conveyed?
- Reproducibility Standards: What documentation/code sharing is required?
Research Project Risk Assessment Framework
Table 4.4 provides a framework for analyzing risks in a research/analysis project. What might be complex or hard to complete?
Risk Framework for Application Development Projects
The requirements for application development projects (dashboards, Shiny apps, web applications) or even analysis pipelines are often high-level descriptions about what “users” should be able to do with the app.
These are insufficient to design code.
- As an example, the client could be considering multiple users for a dashboard from the Senior Executives to mid-level managers to their business analysts.
- Each of these users probably has different questions they want to answer with the dashboard and different skill sets for using the dashboard.
- These different expectations will affect the technical approach for designing and building the dashboard.
Thus, application development projects require a different perspective on requirements analysis than research/analysis projects to shape the technical approach and manage risk.
When working on an application development project, consider deriving requirements for user workflows, interface requirements, and system integration.
Critical Requirements Assessment Areas
- User Experience Workflow Requirements
Software developers uses many different approaches to derive and describe the requirements for an application, ranging from general descriptions to highly detailed templates and diagrams (Scott Ambler 2023).
- These include requirements matrices, wire diagrams, use cases, user templates, etc..
Table 4.5 provides an example framework for asking questions to analyze the requirements for an application development project.
Developing a fully-detailed specification can take a lot of time and effort and no longer as common as it can violate the build-a little, test-a-little axiom for getting user feedback early and often.
- Developers have learned that spending a lot of time to lock down requirements creates its own challenges as clients and users tend to change their mind once they see prototypes, or at least they communicate their expectations differently.
This has led to the the concept of defining “user workflows” which is popular in the design of user interfaces (Tamara Martinez 2025).
- These are much shorter descriptions of the essential requirements to help scope the project while providing clear, testable, expectations in client-friendly language.
A user workflow captures who the user is (a profile of expertise and interests), what you expect them to be able to do with the app (their workflow steps) and the eventual outcome .
- Technical elegance means nothing if users can’t or won’t engage with the system.
Specifying the user workflows helps inform the technical approach, design, and testing strategy for the app.
An project to create an application or analysis pipeline may have multiple user workflows. Here is one example:
Workflow 1: Exploratory Data Analysis
- User Profile: Business analyst with basic statistical knowledge
- Goal: Understand customer behavior patterns
- User Workflow Steps:
- Upload customer dataset
- Generate summary statistics and visualizations
- Filter data by customer segments
- Export insights for presentation
- Data Interactions: Interactive charts, filtering controls, drill-down capabilities
- Outcome: Clear understanding of customer segments for strategic planning
- Functional and Technical Complexity
Another area where high-level requirements can lead to risk is the requirement for High-Effort/High-Risk Application Features:
Review the requirements for these kind of requirements and be sure there are clear definitions and standards for performance.
- Live data feeds and automatic updates
- Real-time collaboration and multi-user access
- Interactive visualizations with instant response
- Risk Factors: Infrastructure complexity, performance optimization needs
- Complex dynamic filtering and drill-down capabilities
- Custom visualization libraries and animations
- User-configurable dashboards and views
- Risk Factors: Frontend development expertise needs, testing complexity
- Multiple data source connections and APIs
- User data upload and processing capabilities
- Integration with existing enterprise systems
- Risk Factors: Authentication, security, data validation needs
- On-demand model training and prediction
- Statistical analysis and hypothesis testing interfaces
- Machine learning model explanation and interpretation
- Risk Factors: Backend computational requirements, result interpretation
- System Integration and Deployment Requirements
Most applications need to be deployed somewhere to be useful.
- If the app is intended for other data scientists, an alternative could be to convert the application (and data?) into a package for distribution rather than deployment.
Table 4.6 provides a framework for asking questions about infrastructure and deployment requirements that can shape the technical approach.
Application Development Risk Assessment
- Underestimating UI/UX Work: Interface design and user experience often require 40-60% of development time
- Deployment Complexity: Getting applications from local development to production can require significant additional work
- User Adoption Challenges: Building something users can use doesn’t guarantee they will use it
To help avoid some of the pitfalls, Table 4.7 provides a framework for asking questions about the requirements to identify risk areas and potential mitigation strategies.
Summary:
Consider Requirements Analysis as an important professional skill.
- Requirements analysis represents a fundamental shift from individual problem solving to professional solution design.
- The process forces systematic thinking about problem interpretation, solution feasibility, and stakeholder alignment.
- These are skills that distinguish successful data science practitioners from those who struggle with project delivery.
- Systems Thinking: Understanding how technical choices affect stakeholders, timelines, and maintenance requirements
- Risk Assessment: Anticipating problems and designing mitigation strategies before implementation begins
- Communication Integration: Designing technical solutions that support diverse stakeholder communication needs
- Feasibility Evaluation: Honestly assessing what’s possible given real constraints rather than ideal conditions
The “think before you code” discipline developed through systematic requirements analysis provides a foundation for:
- Project Leadership: Ability to guide technical teams through complex, ambiguous requirements
- Stakeholder Management: Skills to translate between business needs and technical capabilities
- Strategic Planning: Understanding how technical decisions affect organizational capabilities
- Risk Management: Proactive identification and mitigation of project threats
The investment in thorough requirements analysis pays dividends for projects and throughout professional careers as project complexity increases and stakeholder expectations evolve. The ability to systematically analyze problems, design feasible solutions, and communicate effectively with diverse audiences represents core competencies that enable long-term professional success in data science roles.
Integrate Requirements Analysis with the Literature Review
The requirements analysis and literature review should work together to inform your technical approach.
Don’t just summarize what others have done. Use the literature to validate your requirements analysis and inform technical decisions.
Analyze the literature sources to validate your understanding of complexity, identify proven solutions, and anticipate implementation challenges.
Data Approach
Consider the Analysis Inputs:
- Data source complexity and access constraints
- Quality standards and validation needs
- Integration and update requirements
- Volume and performance expectations
to shape Technical Approach Outputs:
- Specific data acquisition and preprocessing workflows
- Quality control and validation protocols
- Architecture for data storage and access
- Update and maintenance procedures
Methodology Selection and Validation
Use Literature to answer:
- Have similar problems been solved successfully with your proposed methods?
- What performance benchmarks exist for comparable projects?
- What are common failure points and how were they addressed?
- Are there simpler approaches that achieve similar results?
to shape technical decisions:
Research/Analysis Projects:
- Statistical approaches aligned with research questions and data constraints
- Validation strategies matching performance standards and stakeholder needs
- Interpretation frameworks supporting communication requirements
Application Projects:
- User interface frameworks supporting identified workflows and user profiles
- Backend architectures handling identified performance and integration needs
- Testing and deployment strategies addressing organizational constraints
Complexity and Risk Assessment
The literature review can also help inform decisions about risks and mitigation strategies.
Table 4.8 provides some examples of risk indicators you can derive from the literature review.
Deciding on a Technical Approach
When making decisions on the technical approach, consider these four questions:
- Requirements Constraints: What are the non-negotiable technical requirements?
- Literature Evidence: What tools have proven successful for similar challenges?
- Resource Constraints: What tools align with your skill level and timeline?
- Risk Assessment: What tools offer the best balance of capability and reliability?
Your technical approach must address four core elements that work together to deliver your solution.
- Data Strategy
- Methodologies and Methods /Application Design
- Primary Tools and Technology to include enabling Version Control, Collaboration, and Reproducibility
- Project Workflow
Data Strategy
The data strategy defines how data are accessed, managed, transformed, and preserved across the full project life cycle.
- This includes raw data ingestion, intermediate processing, analytical or modeling datasets, and any derived data used for validation, testing, or deployment.
A sound data strategy is foundational for reproducibility, transparency, and maintainability, regardless of whether the project is primarily a research/analysis effort or an application development effort.
The data strategy must explicitly address:
- How raw data are obtained and preserved
- How data are transformed into analysis- or application-ready forms
- How datasets used for modeling, validation, and testing are defined and managed
- How data provenance and versioning are maintained
- Risk and mitigation strategies for the data life cycle.
All downstream technical decisions depend on these choices.
Sources and Access Strategy
This element specifies where data originate and how they are accessed in a repeatable manner.
Key components include:
- Data Source Documentation: Specific databases, APIs, file systems, sensors, or manual collection methods
- Access Protocols: Authentication, approval workflows, rate limits, and retrieval procedures
- Data Rights and Permissions: Usage restrictions, licensing, privacy, and compliance requirements
- Backup and Contingency Sources: Alternative or secondary data sources if primary sources become unavailable
Clearly documenting access strategies reduces project risk and supports reproducibility.
Data Structure, Scale, and Lifecycle Planning
This element characterizes the form, size, and evolution of the data over time.
Key components include:
- Data Formats: CSV, JSON, Parquet, database tables, unstructured text, images, streaming data
- Volume and Growth Expectations: Current size, anticipated growth, computational implications
- Schema Documentation: Variables, data types, keys, and relationships across datasets
- Temporal Characteristics: Historical coverage, update frequency, latency, and seasonality
For application projects, this also includes how data are refreshed or updated during operation.
Data Quality Considerations and Mitigation
This element defines how data quality risks are identified, measured, and addressed.
Key components include:
- Missing Data Strategy: Acceptable thresholds, imputation methods, exclusion rules
- Bias Identification: Sampling, measurement, temporal, or selection biases
- Validation Protocols: Range checks, consistency rules, cross-source comparisons
- Ongoing Quality Monitoring: Automated checks, logging, and alerts where appropriate
Explicit quality strategies prevent hidden assumptions from undermining results or functionality.
Analytical and Modeling Data Management
For projects involving statistical analysis, machine learning, or predictive modeling, the data strategy must clearly define how datasets are constructed and separated.
Key components include:
- Dataset Partitioning: Training, validation, testing, and cross-validation splits
- Reproducible Splits: Fixed random seeds, deterministic partition logic
- Feature Construction: Derived variables, transformations, and feature selection
- Leakage Prevention: Ensuring no information flows improperly between data partitions
For application projects, this includes alignment between analytical datasets and data used in production workflows.
Data Provenance, Versioning, and Reproducibility
Reproducibility requires that all data transformations are traceable and repeatable.
Key components include:
- Raw Data Preservation: Immutable storage of original inputs where feasible
- Transformation Documentation: Scripts or pipelines that generate derived datasets
- Versioning Strategy: Dataset versions tied to code and environment versions
- Reconstruction Capability: Ability to regenerate analytical or application datasets from raw data
These practices ensure results can be reproduced, audited, and extended.
Common underestimations include:
- Time required for data access approvals and API setup
- Data cleaning and preprocessing effort (often 60–80% of project time)
- Integration challenges when combining multiple data sources
- Quality issues discovered only after significant processing
Planning for these realities improves schedule reliability and project outcomes.
Data Risk Identification and Mitigation
Data-related risks can materially affect project validity, reproducibility, timelines, and operational reliability.
- Identifying these risks early allows for mitigation strategies to be incorporated into the technical approach rather than addressed reactively.
Consider known or anticipated data risks and how they will be mitigated.
Data risks typically fall into several overlapping categories:
- Availability Risks: Data may be delayed, incomplete, or become inaccessible
- Quality Risks: Errors, missingness, or inconsistencies may undermine analysis or functionality
- Bias and Representation Risks: Data may not reflect the target population or use case
- Stability Risks: Data distributions or schemas may change over time
- Compliance and Ethical Risks: Legal, privacy, or licensing constraints may restrict use
Explicitly identifying which categories apply improves transparency and planning.
Risk Assessment and Mitigation Planning
Each identified data risk should be assessed for likelihood, impact, and mitigation strategy.
Table 4.9 provides some examples of data risks.
Documenting these risks supports informed decision-making and reviewer confidence.
Data risks are not static and may evolve as a project progresses.
Recommended practices include:
- Periodic reassessment of data risks
- Automated checks for schema, distribution, and volume changes
- Logging and alerting for data ingestion or validation failures
- Revisiting mitigation strategies after major data updates
Ongoing monitoring ensures that data risks remain visible and manageable.
Explicit identification and management of data risks:
- Improves reproducibility and analytical validity
- Reduces downstream rework and unexpected failures
- Supports ethical and compliant data use
- Strengthens confidence in results and system behavior
Incorporating data risk management into the data strategy ensures that data-related uncertainties are acknowledged and addressed as part of the overall technical approach.
Summary
A robust data strategy:
- Treats data management as a first-class design decision
- Supports reproducibility from raw inputs through final outputs
- Applies consistently across research/analysis and application projects
- Reduces technical risk and improves long-term maintainability
Clear data strategy decisions strengthen the entire technical approach by ensuring that all subsequent analysis, modeling, and application behavior is grounded in well-managed data.
Methodologies for Research/Analysis Projects
Your methodology section must clearly connect research/analysis questions to analytical approaches.
The following framework is consistent with methodological expectations commonly found in journals emphasizing clarity, reproducibility, and rigor.
1. Research Questions and Objectives
The research questions define the purpose and scope of the project and shape all subsequent methodological choices.
Key components include:
- Clearly articulated primary and secondary research questions
- Hypotheses or decision objectives, where applicable
- Scope boundaries and assumptions
Some examples of questions types and associated methods are:
- Descriptive Questions (“What patterns exist?”)
- Exploratory data analysis, clustering, visualization methods
- Predictive Questions (“What will happen?”)
- Machine learning models, time series forecasting, regression analysis
- Causal Questions (“What causes what?”)
- Experimental design, causal inference methods, natural experiments
- Comparative Questions (“Which is better?”)
- A/B testing, statistical hypothesis testing, comparative analysis
A well-defined research question ensures that the analysis is targeted, interpretable, and testable.
2. Core Analytical or Research Elements
This element specifies what is being studied and analyzed.
Key components include:
- Data sources and data provenance
- Variables, features, or constructs of interest
- Data quality assumptions and preprocessing requirements
- Conceptual or theoretical framework, if applicable
Clearly defining analytical elements establishes transparency and supports reproducibility.
3. Study Design and Analytical Strategy
The study design describes how the research or analysis shall be conducted.
Key components include:
- Study type (e.g., observational, experimental, quasi-experimental, simulation)
- Sampling strategy or data partitioning approach
- Analytical methods, statistical models, or algorithms
- Validation, robustness checks, or sensitivity analyses
Table 4.10 provides additional considerations for designing the research or analysis project.
Sound study design is critical for managing bias, ensuring validity, and supporting reliable inference.
4. Metrics, Evaluation, and Interpretation Criteria
Metrics define how results are evaluated and how conclusions are drawn.
Key components include:
- Performance or outcome metrics
- Statistical tests or uncertainty measures
- Error tolerances and confidence criteria
- Predefined success or decision thresholds
Defining metrics in advance helps prevent post-hoc interpretation and strengthens analytical rigor.
Methodology Risk Assessment
Choosing methodologies and methods often requires trade offs among performance, speed, and risk.
Consider the following as you choose your methodologies and methods.
- Novel/Experimental Methods: Cutting-edge techniques without established validation
- Complex Ensemble Models: Multiple algorithms requiring extensive tuning and interpretation
- Causal Inference Methods: Instrumental variables, difference-in-differences requiring strong assumptions
- Custom Algorithm Development: Building methods from scratch rather than using established libraries
- Advanced Machine Learning: Deep learning, complex feature engineering, hyper-parameter optimization
- Time Series Methods: Sophisticated forecasting models, change point detection
- Multivariate Statistical Methods: Factor analysis, structural equation modeling
- Bayesian Methods: MCMC sampling, hierarchical models requiring specialized expertise
- Standard Statistical Tests: t-tests, ANOVA, chi-square tests with established implementations
- Basic Machine Learning: Linear regression, decision trees, random forests using standard libraries
- Descriptive Analytics: Summary statistics, basic visualization, correlation analysis
- Established Survey Methods: Validated instruments, standard sampling procedures
Summary
This four-element framework aligns closely with expectations found in journals which emphasize:
- Clear scientific objectives and clearly articulated research questions
- Explicit data and assumption disclosure
- Well-defined analytical elements
- Reproducible study design and data (see JASA Reproducibility Guidelines)
- Transparent evaluation and interpretation following pre-specified metrics and evaluation criteria
Together, these elements provide a defensible and transparent foundation for rigorous research and analysis.
Application Design and Architecture
The application design must clearly connect functional requirements and user workflow descriptions to interface, architectural, and implementation decisions.
The following framework emphasizes clarity, traceability, and feasibility, consistent with best practices in applied software design and engineering.
1. Functional Requirements and User Workflows
Functional requirements and user workflows define the purpose, scope, and behavior of the application and constrain all downstream design decisions.
Key components include:
- Clearly defined user roles and personas
- Primary and secondary user workflows
- Functional requirements mapped to user actions
- Assumptions and scope boundaries
Examples of workflow-driven design considerations include:
- Exploratory Workflows (“What information do users need to explore?”)
- Interactive filtering, summary views, flexible navigation
- Operational Workflows (“What actions must users complete?”)
- Form inputs, validation, stepwise processes, confirmations
- Decision-Support Workflows (“What decisions are users making?”)
- Visual prioritization, comparisons, alerts, thresholds
- Administrative Workflows (“How is the system managed?”)
- Configuration panels, logging, access control
Well-defined workflows ensure the application is usable, testable, and aligned with user needs.
2. Core Application Elements
This element specifies the essential components required to support the defined workflows and functional requirements.
Key components include:
- Input types (forms, file uploads, parameters, selections)
- Output types (tables, visualizations, reports, notifications)
- State management and data flow
- Usability, accessibility, and performance assumptions
Clearly defining core application elements establishes a shared understanding of system behavior and reduces implementation ambiguity.
3. Interface Design and Interaction Strategy
The interface design describes how users interact with the application and how functionality is organized and presented.
Key components include:
- Layout and navigation structure
- Visual hierarchy and information prioritization
- Interaction patterns and feedback mechanisms
- Error handling and validation strategies
Table 4.11 provides additional considerations for interface planning.
Sound interface design is critical for usability, adoption, and maintainability.
4. Architecture and Implementation Strategy
Architecture decisions describe how application functionality is implemented and deployed.
Key components include:
- Frontend and backend responsibilities
- Data storage and persistence strategy
- Performance and scalability considerations
- Deployment and maintenance assumptions
Table 4.12 summarizes common architectural decision points.
Architecture choices should balance functional requirements, technical feasibility, and long-term sustainability.
Application Design Risk Assessment
Design and architecture decisions involve trade-offs among functionality, complexity, development effort, and future extensibility.
Consider the following categories when selecting tools and design patterns.
- Highly Custom Interfaces: Extensive bespoke UI logic and styling
- Tightly Coupled Architectures: Frontend and backend interdependencies
- Unproven Frameworks: Limited documentation or community support
- Real-Time or Low-Latency Requirements: Strict performance constraints
- Advanced Interactivity: Complex state management, reactive updates
- Scalable Architectures: Multi-user concurrency, shared resources
- Integration with External Systems: APIs, authentication providers
- Moderate Custom Visualization: Specialized charting or interaction patterns
- Standard Layouts: Well-established navigation and page patterns
- Established Frameworks: Mature tools with strong community support
- Static or Semi-Static Outputs: Reports, dashboards with limited interactivity
- Single-User or Read-Only Applications: Minimal concurrency concerns
Summary
This application design framework emphasizes:
- Clear functional requirements and user workflows
- Explicit definition of core application elements
- Thoughtful interface and interaction design
- Feasible and maintainable architectural choices
Together, these elements provide a structured and defensible foundation for designing applications that are usable, maintainable, and aligned with user needs.
Tools for Reproducibility and Maintainability
Reproducible and maintainable technical work, whether research-focused or application-oriented, requires explicit management of software environments, dependencies, and collaboration workflows.
- Without appropriate processes and tools, results become difficult to reproduce, extend, or maintain over time.
Following best practices can enable reproducibility and maintainability across project types.
Dependency and Environment Management
Projects must explicitly define and manage their software environments to ensure consistent behavior across systems and over time.
Key goals include:
- Reproducible package versions
- Isolation from system-wide dependencies
- Ease of setup for collaborators and reviewers
Table 4.14 shows several examples of tools used to help manage and control the technical environment.
Best practices include:
- Committing lockfiles (e.g.,
renv.lock, uv.lock) to version control
- Documenting environment setup steps
- Avoiding reliance on implicit or system-installed packages
Well-managed environments reduce “it worked on my machine” failures and support long-term project viability and reproducibility.
Version Control and Collaborative Development
Version control systems are essential for reproducibility, traceability, and collaboration in both research and application development.
Projects should use a distributed version control system (e.g., Git) to track changes to:
- Code
- Configuration file, including hyper-parameters
- Documentation
- Environment definitions
Cloud-based repositories provide additional benefits, including issue tracking, code review, and automated testing.
Common platforms include:
Reproducibility and Collaboration Practices
Effective use of Git and hosted repositories supports both individual rigor and team collaboration.
Recommended practices include:
- Structured Repositories
- Clear directory layout (data, code, docs, config)
- Explicit README describing project purpose and setup
- Commit Discipline
- Small, meaningful commits
- Informative commit messages
- Version-controlled milestones or releases
- Collaboration Workflows
- Feature branches for development
- Pull/merge requests for review
- Issue tracking for bugs and enhancements
- Reproducibility Support
- Version-controlled data inputs or data access instructions
- Tagged releases corresponding to results or deliverables
- Automated checks where feasible
These practices support peer review, facilitate onboarding, and enable reliable reuse of project outputs.
Managing tool environments and collaboration infrastructure is a core component of a sound technical approach.
Across both research/analysis and application projects, these practices:
- Enable reproducibility and transparency
- Reduce maintenance and on-boarding costs
- Support collaboration and review
- Preserve the integrity of results and deliverables
Explicit attention to environment management and version control ensures that technical work remains reliable, extensible, and defensible over time.
Summary
A unified approach to tool and technology selection:
- Applies consistent principles across research/analysis and application projects
- Uses parallel examples to reflect different project contexts
- Encourages explicit justification and risk awareness
- Supports reproducibility, maintainability, and long-term project success
By focusing on shared concepts rather than specific tools, this framework ensures technology choices align with project goals.
A Workflow for the Technical Approach
Once the data strategy, methodologies, methods, and tools have been selected, the next step is to define a technical workflow that makes the relationships among these elements explicit.
The workflow demonstrates your ability to integrate all the elements of the technical approach into a concise coherent process, showing how data, methods, and tools interact over time and how work progresses from inputs to outputs.
A well-designed workflow should:
- Demonstrate clear connections between data sources, analytical methods, and tools
- Reflect the logical sequencing of technical tasks
- Make dependencies and hand offs between steps visible
- Align the technical approach with the project plan and timeline
- Be converted into a graphical representation.
The workflow is not merely a process diagram, it is a concise visual argument for why the technical approach is coherent and feasible.
Workflow Design Considerations
When designing a workflow graphic, consider the following:
- Phases: Distinct stages such as data ingestion, preprocessing, analysis/modeling, validation, and delivery
- Data Artifacts: Where raw, intermediate, and final datasets are created and used
- Methodological Transitions: How outputs of one method become inputs to the next
- Tool Usage: Which tools or environments are responsible for each step
- Iteration and Feedback: Where revision, validation, or retraining may occur
There is no single “correct” workflow structure; the flow should reflect the specific technical approach of the project.
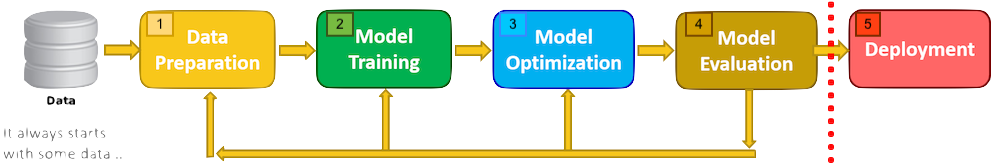
Example Workflow
Figure 4.1 provides one example of a project workflow that integrates data preparation, modeling, evaluation, and deployment.
Design notes:
- Workflow steps are explicitly numbered to support easy reference
- Each step corresponds to a distinct technical phase
- The flow communicates both sequence and dependency
You can create the workflow diagram using a variety of tools to include mermaid or GraphViz in Quarto
Summary
The technical workflow:
- Integrates data strategy, methodology, and tooling into a single coherent view
- Makes sequencing and dependencies explicit
- Supports reproducibility and project planning
- Serves as a high-impact visual summary of the project’s technical approach
Students should treat the workflow diagram as a first-class deliverable that communicates not just what they did, but how and why the technical approach fits together.
Documenting the Rationale for the Technical Approach
Once the technical approach has been finalized, it is good practice to provide a concise rationale explaining why specific data strategies, methodologies, methods, and tools were selected.
The rationale is not a restatement of the technical approach. Instead, it is a justification layer that makes explicit how decisions were informed by requirements, constraints, and existing evidence.
The rationale should demonstrate that technical decisions were:
- Requirement-driven rather than preference-driven
- Informed by relevant literature or established practice
- Appropriate given project constraints (data, time, risk, resources)
- Internally consistent across data, methods, and tools
A strong rationale allows reviewers to understand why these choices make sense, even if alternative approaches exist.
The rationale must explicitly connect: Requirements Analysis Findings and Literature Review Evidence to Technical Decisions.
This connection should be made visible for each major element of the technical approach, including:
- Data strategy
- Methodological choices
- Analytical or modeling methods
- Tool and technology selection
Recommended Rationale Structure
Rationale statements should follow a consistent, evidence-based pattern.
Example structure:
Based on requirements analysis identifying [specific constraint or need] and literature evidence showing [proven approach, benchmark result, or established best practice], we selected [specific method, design choice, or tool] because [explicit reasoning linking requirements and evidence to the decision].
Illustrative Examples
Based on requirements analysis identifying limited labeled data and literature demonstrating strong performance of regularized linear models in low-sample settings, we selected ridge regression to reduce overfitting risk.
Based on requirements analysis indicating a need for reproducible analysis pipelines and literature emphasizing environment isolation for computational reproducibility, we adopted renv to manage R package dependencies.
Based on requirements analysis highlighting exploratory user workflows and literature supporting interactive visualization for sense-making, we selected an interactive dashboard-based interface.
Scope and Level of Detail
The rationale should be:
- Concise: Focus on major decisions, not every minor implementation detail
- Selective: Emphasize choices with meaningful trade-offs or alternatives
- Evidence-based: Reference literature, benchmarks, or established practice where applicable
Length is less important than clarity and traceability.
Summary
Documenting the rationale for the technical approach ensures:
- Technical choices are transparent and defensible
- Decisions can be evaluated independently of outcomes
- The project demonstrates methodological maturity and rigor
A clear rationale shows not only what technical approach was chosen, but why it was the appropriate choice given the project’s requirements and evidence base.
Responsible Data Science Review
Reviewing for considerations of responsible data science should occur throughout the data science life cycle.
- It is especially important during the framing step as this shapes the technical approach which can dominate other aspects of the project.
Once the technical approach has been defined and justified, data scientists should conduct a Responsible Data Science (RDS) review to evaluate the ethical, social, and practical implications of their choices.
- The RDS should not be an abstract discussion of ethics or bias. It is a structured examination of the specific data, methods, tools, and workflows used in the project, using an explicit responsibility framework.
The RDS review ensures the technical approach:
- Anticipates potential harms or unintended consequences and mitigates their effects
- Treats data subjects and stakeholders responsibly
- Produces results that are fair, interpretable, and appropriate for use
- Aligns with professional, legal, and societal expectations
A strong RDS review demonstrates how the data scientist considered technical rigor and responsibility together, not separately.
Framework Selection
There are multiple frameworks for responsible data science and you don’t have to look at all of them.
Selecting a recognized Responsible Data Science or AI ethics framework to structure the review helps establish credibility for the analysis.
Examples of commonly used frameworks include:
- General Frameworks
- American Statistical Association (ASA): Ethical Guidelines for Statistical Practice help evaluate professional responsibility in statistical reasoning, data collection, analysis, interpretation, reproducibility, and communication of results.
- Association for Computing Machinery (ACM): ACM Code of Ethics and Professional Conduct help assess ethical responsibilities in software, algorithms, systems design, privacy protection, and accountability for deployed technical systems.
- Royal Statistical Society: A Guide for Ethical Data Science address five themes from multiple ethical frameworks that apply across data science work.
- Data Focused
There are many other domain specific frameworks that cover topics such as human subject research, working with data about minors, or working with medical data that has privacy concerns.
The chosen framework should be briefly identified and justified based on the project context.
Core Dimensions to Examine
Using the selected framework, examine the technical approach across the following dimensions.
Data Responsibility
Consider how the framework applies to how data are collected, used, and managed.
Key questions could include:
- Are data sources appropriate and ethically obtained?
- Do data rights, consent, or licensing restrictions apply?
- Could data quality or bias affect downstream outcomes?
- Are privacy and confidentiality adequately protected?
Methodologogy and Methods
Consider how the framework applies to choices in methodology or methods that may introduce risk or harm.
Key questions could include:
- Do chosen methods amplify bias or inequity?
- Are assumptions transparent and defensible?
- Are results interpretable by intended audiences?
- Could model misuse or overconfidence lead to harm?
The goal is not to avoid advanced methods, but to acknowledge their implications.
Evaluation and Metrics Responsibility
Consider how the framework applies to whether evaluation criteria align with responsible use.
Key questions could include:
- Do metrics reflect meaningful outcomes, not just technical performance?
- Are error rates or uncertainty communicated clearly?
- Are trade-offs (e.g., accuracy vs. fairness) acknowledged?
- Are validation and testing procedures sufficient to detect failure modes?
Metrics shape behavior and interpretation; this makes them ethically relevant.
Deployment, Use, and Communication Context
For application or decision-support projects, consider how the framework applies to the use cases and results.
Key questions could include:
- Who will use the outputs, and for what purpose?
- Could results be misunderstood or misapplied?
- Are limitations and appropriate use clearly communicated?
- Is ongoing monitoring or review required?
Even research outputs can influence decisions and should be framed responsibly.
Identified Risks and Mitigations
The RDS review should explicitly document:
- Identified ethical, fairness, privacy, or misuse risks
- The likelihood and potential impact of these risks
- Mitigation strategies incorporated into the technical approach
If the review identifies significant issues in the technical approach, update the technical approach and the rationale discussion.
The RDS complements the data and technical risk assessments but focuses on human and societal impact.
Summary
The Responsible Data Science review:
- Applies an explicit framework to the finalized technical approach
- Makes ethical and societal considerations visible and reviewable
- Demonstrates professional responsibility alongside technical competence
A well-executed RDS review shows that the project is not only technically sound, but also thoughtful, defensible, and appropriate for its intended context.
Feasibility and Risk Alignment Check
An elegant technical approach that does everything you want can be a beautiful creation; it can also be a siren call to project failure.
The technical approach must be feasible within the constraints of the project plan to be useful.
Given the integrated nature of project management and solution development, the technical approach must be evaluated for acceptability, affordability, and feasibility after it has been designed and justified.
- Acceptability: The technical approach must deliver a solution that meets defined acceptance criteria and stakeholder expectations.
- Affordability: The technical approach must be executable within the available resources defined in the project plan.
- Feasibility: The technical approach must be capable of delivering the solution within the required timeline and operational constraints.
Checking Feasibility Is a Reality Check
After developing the technical approach, return to the requirements analysis and project plan to verify alignment.
Ask the following questions explicitly:
- Do the selected data, methods, and tools address the identified requirements and acceptance criteria? (Acceptable?)
- Can the technical approach be executed within the available time, staffing, and computational resources? (Affordable?)
- Can the complexity of the approach realistically deliver results on the required timeline? (Feasible?)
- Have appropriate mitigation strategies been planned for the highest-risk components? (Feasible?)
This is the point where optimism must meet realism.
- Identifying issues now is far less costly than discovering them mid-project.
Phase-Level Feasibility Analysis
For each project phase, analyze the alignment between the technical approach and planned resource allocation.
Consider:
- What could go wrong with this part of the technical approach?
- How likely are these problems given your constraints?
- What adjustments are being made to reduce risk?
- How will early warning signs be monitored during execution?
Planned Effort vs. Reality
- How much time is allocated for data access, cleaning, and preparation?
- Are iterative data quality discoveries accounted for?
- What happens if data are messier or less complete than expected?
Technical Approach Alignment
- Do preprocessing methods match the actual data complexity?
- Are selected tools appropriate for data volume and format?
- Is sufficient time allocated for exploratory analysis?
Planned Effort vs. Reality
- How much time is allocated for method learning curves?
- Are hyper-parameter tuning, validation, and robustness checks included?
- Is sufficient time allocated for interpretation and documentation?
Technical Approach Alignment
- Do selected methods match the team’s demonstrated skill level?
- Are tools mature and well-supported, or experimental?
- Is iteration explicitly planned rather than assumed away?
Planned Effort vs. Reality
- How much time is allocated for UI/UX design and implementation?
- Are testing, debugging, and revision cycles included?
- Is time allocated for user feedback and refinement?
Technical Approach Alignment
- Do framework choices align with development experience?
- Is the focus on a minimum viable product or unnecessary feature expansion?
- Are deployment and integration tasks explicitly planned?
Risk Assessment Integration
- Technical Overconfidence: “I’ll figure it out as I go”
- Timeline Optimism: “Everything will work the first time”
- Scope Creep Denial: “The requirements won’t change”
- Resource Assumptions: “Help will be available when needed”
Table 4.15 provides some examples of risks that affect overall project feasibility and possible mitigation strategies.
Adjustment Strategies
When feasibility analysis reveals problems in acceptability, affordability or feasibility, you have to adjust as in Figure 4.2.
Here are possible options for adjusting the project.
- All of these require Project Manager approval.
- Some of these (e.g., adjusting requirements, acceptance criteria or schedule delays) require collaboration and approval from the client.
- Changes in budgets or resources may require client approval as well depending upon the contract type.
Option 1: Scope Adjustment
- Reduce deliverable complexity
- Focus on core requirements
- Plan phased implementation
Option 2: Method Simplification
- Choose more familiar techniques
- Reduce analytical sophistication
- Prioritize reliable over optimal
Option 3: Resource Reallocation
- Extend timeline if possible
- Seek additional expertise
- Reduce other project commitments
Option 4: PWS Renegotiation
- Communicate constraints early
- Propose alternative success metrics
- Document trade-off implications
You cannot optimize all three simultaneously:
- Performance: What is the balance between meeting the acceptance criteria and going beyond the requirement or client’s expectations. “If the minimum performance to meet the acceptance criteria were not”good enough”, they would have set different acceptance criteria.”
- Schedule: Is there benefit to a sophisticated or complicated approach that might delay delivery for a small increase in performance?
- Resources: How much time/expertise is realistically available? Can you trade off a more expensive person for less expensive without undue risk?
Your technical approach must make explicit trade-offs between these factors.
After making any necessary adjustments, assess your feasibility analysis should conclude with a clear statement:
Strong Feasibility: “Based on this analysis, the proposed technical approach can deliver PWS requirements within the planned timeline and resource allocation, with acceptable risk levels managed through identified mitigation strategies.”
Conditional Feasibility: “The technical approach is feasible with the following adjustments: [specific changes to scope/timeline/methods], which maintain PWS core objectives while ensuring realistic delivery expectations.”
Challenged Feasibility: “Analysis reveals significant feasibility concerns requiring PWS renegotiation around [specific requirements] to align expectations with available resources and realistic technical constraints.”
Summary
This final feasibility and risk review ensures the technical approach is not only conceptually sound, but also:
- Deliverable within project constraints
- Aligned with requirements and acceptance criteria
- Realistic in terms of effort, complexity, and risk
Feasibility analysis is an ongoing process throughout project execution. The discipline of systematic thinking about requirements, constraints, and feasibility should inform decision-making at every project phase, not just the initial framing of the project.
ACM. 2025.
“ACM Code of Ethics and Professional Conduct.” https://www.acm.org/code-of-ethics.
“CARE Principles.” n.d.
Global Indigenous Data Alliance. Accessed January 5, 2026.
https://www.gida-global.org/care.
“FAIR Principles.” n.d.
GO FAIR. Accessed January 5, 2026.
https://www.go-fair.org/fair-principles/.
Scott Ambler. 2023.
“Agile Requirements Modeling: Strategies for Agile Teams.” https://agilemodeling.com/essays/agilerequirements.htm.
Tamara Martinez. 2025.
“User Workflows for UX Design.” https://www.capicua.com/blog/user-workflow-ux-design.